
My Data API Dashboard
A clear, read-only view of the indicators included in your SentimenTrader Data API subscription.
Your subscribed indicators, ready to explore
A ready-made dashboard that lists the indicators included in your SentimenTrader Data API subscription, so you can open any of them without building a dashboard yourself.
Data API access, through your connected assistant
SentimenTrader Data API customers
The indicators in the dashboard follow the Data API access included in your subscription.
A connected AI assistant
You need an AI assistant connected to SentimenTrader. The dashboard opens through that connection.
Today’s reading, its history, and what followed
Review each subscribed indicator without downloading files or assembling charts by hand.
Latest readings
See the current value, its date, and recent changes for the indicator you open.
History and percentile
Use the historical chart and percentile context to see where today’s reading sits.
What happened next
Explore how the S&P 500 (SPY) performed after similar readings in the past.
Dashboard preview
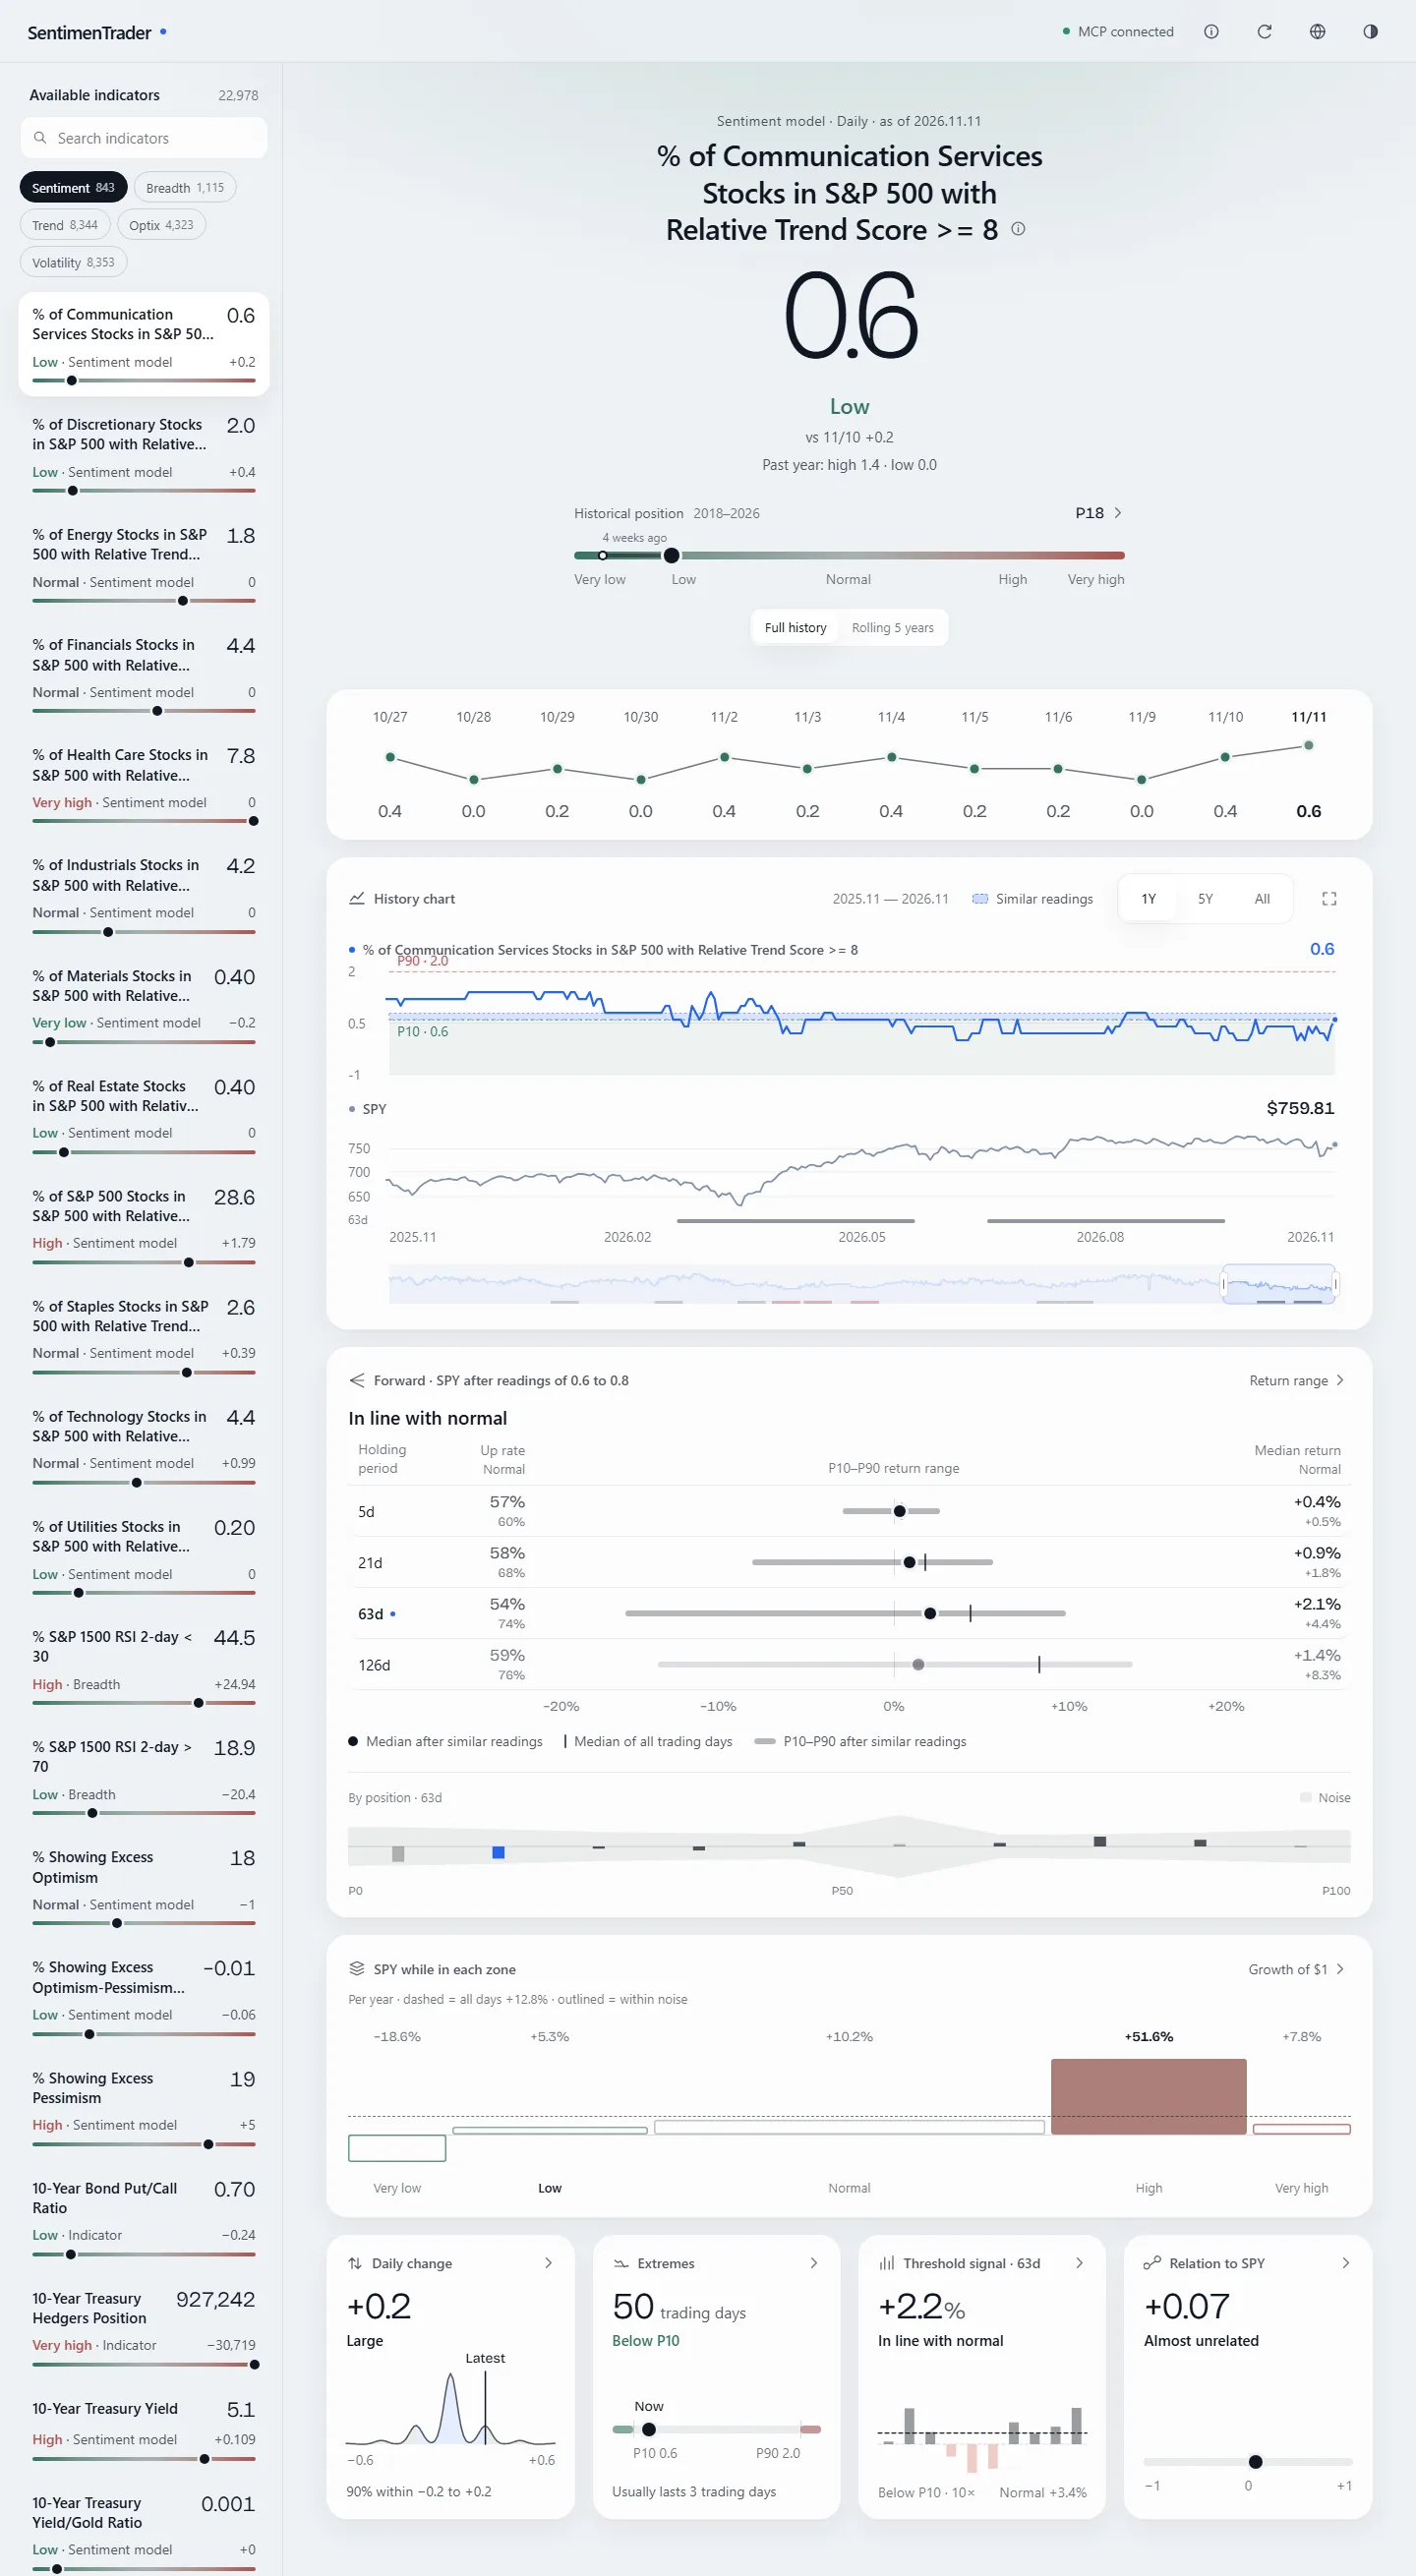 Click to enlarge
For example: if your subscription includes 20 indicators supported by the dashboard, all 20 will be available to browse, grouped into Sentiment, Breadth, Trend, Optix, and Volatility.
Read-only. The dashboard cannot place trades or change your account.
Ask your assistant in one line
No installation
Connect SentimenTrader to your AI assistant once. In an assistant that supports MCP Apps, say the phrase above and the dashboard opens inside the conversation. There is nothing to install and no separate sign-in.
Opens on this computer
For assistants that cannot show the dashboard in the chat, such as terminal tools, the assistant sets up the same read-only dashboard and opens http://127.0.0.1:4174 in your web browser.
Connect once, in the assistant you use
ChatGPT
In ChatGPT’s settings, add SentimenTrader as a custom app with the address below, then sign in. ChatGPT may ask you to turn on developer mode first, and on Business and Enterprise workspaces an admin may need to allow custom apps. Then say the phrase: the dashboard opens inside the chat.
Claude
In Claude’s settings, open Connectors and add a custom connector with the address below, then sign in. In the Claude desktop and web apps, the dashboard opens inside the chat. On Team and Enterprise plans, an Owner adds the connector once, then each member connects to it.
Terminal assistants
Claude Code and other terminal assistants connect through the MCP setup guide. The same phrase opens the dashboard in your browser at http://127.0.0.1:4174.
https://st-tools.sentimentrader.com/mcp-server/mcp
Come back the same way you opened it
Ask again at any time
To return to the dashboard, say the same phrase in any chat with your connected assistant.
Restart it through your assistant
After a restart, ask your assistant to open the dashboard again. It starts the local app and returns the browser link at http://127.0.0.1:4174.
Technical details
The assistant calls open_indicator_workbench through your existing SentimenTrader MCP connection. Follow the MCP setup guide once; browser OAuth handles sign-in, and your assistant never needs your password, token, or Authorization header.
Technical users can also install the slash-command skill and type /indicator-workbench. The same dashboard can run as a standalone local app on Windows, macOS, and Linux.
Which indicators are listed. The dashboard lists and counts only the indicators it can chart on their own. Combined charts that pair two of them, such as 20-day and 60-day historical volatility or Trend and RelTrend Score, are left out, and their two single lines are listed individually; seasonality series are left out as well. Everything remains available through the Data API and your assistant, so your Data API catalog can be larger than the dashboard’s count.