
SentimenTrader Tools API
Base URL
https://st-tools.sentimentrader.com/
Authentication
All API endpoints require authentication. Two methods are supported:
HTTP Basic Auth
Include an Authorization header with every request:
Authorization: Basic <base64(username:password)>
cURL example:
curl -u your_username:your_password \
  "https://st-tools.sentimentrader.com/seasonality/performance-by-week?ticker=SPY"
Python example (requests):
import requests

response = requests.get(
    "https://st-tools.sentimentrader.com/seasonality/performance-by-week",
    params={"ticker": "SPY"},
    auth=("your_username", "your_password")
)
Subscription Validation
The server verifies username/password and checks that the account has an active
subscription with an authorized Recurly plan code. Unauthorized accounts receive a 401/403 response.
Public Endpoints (No Auth Required)
The following endpoints do not require authentication:
| Endpoint | Description |
|---|---|
/health |
Health check |
Common Response Format
Endpoints return one of these formats:
// Standard (scanner_trader, cpm, smart_scanner) - includes "msg"
{"code": 200, "msg": "Finish ...!", "data": {}}

// Minimal (seasonality, symbol_corr, asset_corr, pattern_corr, symbol_beta) - no "msg"
{"code": 200, "data": {}}
Response Codes
| Code | Meaning | Used By |
|---|---|---|
| 200 | Success | All endpoints |
| 211 | Success (variant, no msg) | symbol_corr, asset_corr, pattern_corr, symbol_beta |
| 401 | Authentication required | All endpoints |
| 403 | Subscription not authorized | All endpoints |
| 400 | Invalid parameter | All endpoints |
| 404 | Data not found | seasonality, smart_scanner, company_detail (invalid symbol) |
| 407 | No results found | scanner_trader (empty results), cpm (no pattern matches) |
| 411 | Insufficient data / Error | symbol_corr, asset_corr, pattern_corr, symbol_beta |
| 500 | Server error | All endpoints |
1. Seasonality Analysis
Just as moon phases impact tidal activity, there are consistent forces at work in the equities markets. Not all of them are understood, but they include mutual fund flows, options activity, weekend exposure effects, etc. To view it on our website, please click here.
All individual endpoints share these common query parameters:
| Name | Type | Required | Description | Example |
|---|---|---|---|---|
| ticker | string | Yes | Stock/index symbol | "SPY" |
| start_year | string | No | Start year (default: current year - 20) | "2020" |
| end_year | string | No | End year (default: current year) | "2026" |
1.1 Get Predefined Holidays
GET /seasonality/get-predefined-holidays
Returns a list of all available holiday names for use with performance-around-holiday.
Response Example:
{
    "code": 200,
    "data": {
        "holidays": [
            "Christmas Day",
            "December Quad Option Expiration",
            "Election Day(US)",
            "FOMC Decision Day",
            "Good Friday",
            "Independence Day",
            "June Quad Option Expiration",
            "Labor Day",
            "MLK Jr. Day",
            "March Quad Option Expiration",
            "Memorial Day",
            "Monthly Option Expiration",
            "New Year's Day",
            "President's Day",
            "September Quad Option Expiration",
            "Thanksgiving Day"
        ]
    }
}
Response Fields:
| Field | Description |
|---|---|
holidays |
List of all predefined holiday names for use with performance-around-holiday |
1.2 Return by Day of Week
GET /seasonality/performance-by-week
Average return and positive percentage by day of week (Mon-Fri).
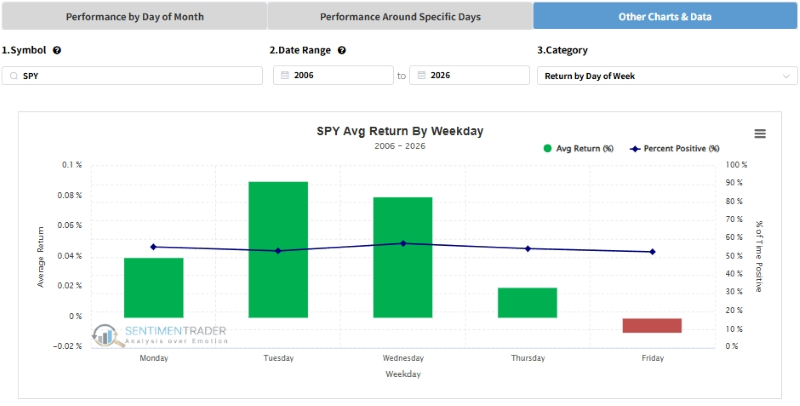
performance-by-week
Request:
GET /seasonality/performance-by-week?ticker=SPY&start_year=2006&end_year=2026
Response:
{
    "code": 200,
    "data": [
        {
            "Weekday": "Monday",
            "Return": 0.04,
            "Positive": 55.42
        },
        {
            "Weekday": "Tuesday",
            "Return": 0.09,
            "Positive": 53.33
        },
        {
            "Weekday": "Wednesday",
            "Return": 0.08,
            "Positive": 57.41
        }
        ...
    ]
}
Response Fields (each item in data array):
| Field | Description |
|---|---|
Weekday |
Day of week (Monday–Friday) |
Return |
Average return (%) for that weekday across all years |
Positive |
Percentage of times the return was positive (%) |
1.3 Return by Month
GET /seasonality/performance-by-month
Average return and positive percentage for each month (Jan-Dec).
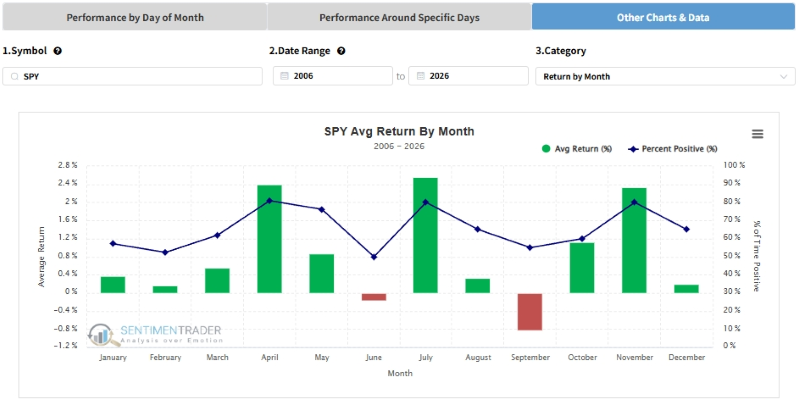
performance-by-month
Request:
GET /seasonality/performance-by-month?ticker=SPY&start_year=2006&end_year=2026
Response:
{
    "code": 200,
    "data": [
        {
            "Month": "January",
            "Return": 0.37,
            "Positive": 57.14
        },
        {
            "Month": "February",
            "Return": 0.17,
            "Positive": 52.38
        },
        {
            "Month": "March",
            "Return": 0.56,
            "Positive": 61.9
        }
        ...
  ]
}
Response Fields (each item in data array):
| Field | Description |
|---|---|
Month |
Month name (January–December) |
Return |
Average return (%) for that month across all years |
Positive |
Percentage of times the return was positive (%) |
1.4 Performance by Day of Month
GET /seasonality/performance-by-day-of-month
Stats (avg return, max, min, % positive) for every calendar day (1-31) across all months.
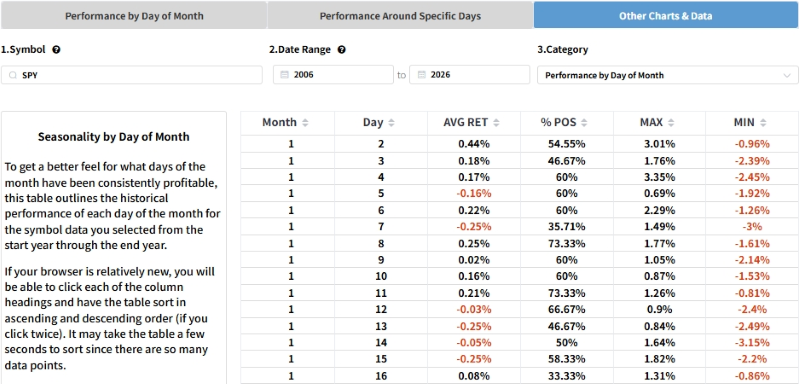
performance-by-day-of-month
Request:
GET /seasonality/performance-by-day-of-month?ticker=SPY&start_year=2006&end_year=2026
Response:
{
    "code": 200,
    "data": [
        {
            "Month": "01",
            "Day": "02",
            "AVG RET": 0.44,
            "MAX": 3.01,
            "MIN": -0.96,
            "% POS": 54.55
        },
        {
            "Month": "01",
            "Day": "03",
            "AVG RET": 0.18,
            "MAX": 1.76,
            "MIN": -2.39,
            "% POS": 46.67
        },
        {
            "Month": "01",
            "Day": "04",
            "AVG RET": 0.17,
            "MAX": 3.35,
            "MIN": -2.45,
            "% POS": 60.0
        }
        ...
  ]
}
Response Fields (each item in data array):
| Field | Description |
|---|---|
Month |
Month number ("01"–"12") |
Day |
Calendar day ("01"–"31") |
AVG RET |
Average return (%) on this calendar day across all years |
MAX |
Maximum return (%) on this calendar day |
MIN |
Minimum return (%) on this calendar day |
% POS |
Percentage of times the return was positive (%) |
1.5 Performance by Day of Year
GET /seasonality/performance-by-day-of-year
Stats for every trading day of the year (day 1-252).
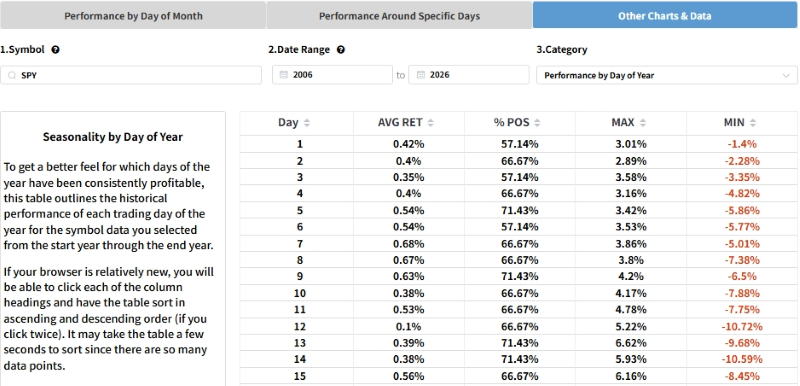
performance-by-day-of-year
Request:
GET /seasonality/performance-by-day-of-year?ticker=SPY&start_year=2006&end_year=2026
Response:
{
    "code": 200,
    "data": [
        {
            "Day": 1,
            "AVG RET": 0.42,
            "MAX": 3.01,
            "MIN": -1.4,
            "% POS": 57.14
        },
        {
            "Day": 2,
            "AVG RET": 0.4,
            "MAX": 2.89,
            "MIN": -2.28,
            "% POS": 66.67
        },
        {
            "Day": 3,
            "AVG RET": 0.35,
            "MAX": 3.58,
            "MIN": -3.35,
            "% POS": 57.14
        }
        ...
  ]
}
Response Fields (each item in data array):
| Field | Description |
|---|---|
Day |
Trading day of year (1–252) |
AVG RET |
Average return (%) on this trading day across all years |
MAX |
Maximum return (%) on this trading day |
MIN |
Minimum return (%) on this trading day |
% POS |
Percentage of times the return was positive (%) |
1.6 Performance Around Holiday
GET /seasonality/performance-around-holiday
Performance around a specific holiday. Returns data for days before/after the holiday.
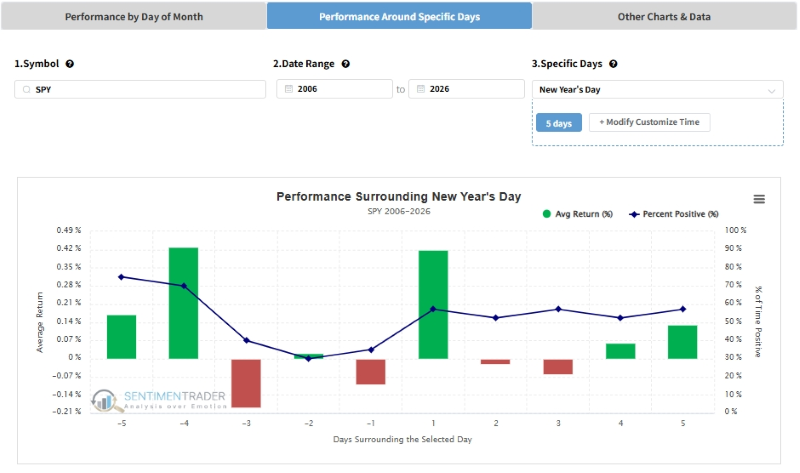
performance-around-holiday
Extra Parameters:
| Name | Default | Description |
|---|---|---|
| holiday_name | nearest upcoming holiday | Holiday name (use GET /seasonality/get-predefined-holidays to
get the full list)
|
| shift | 5 | Days window around the holiday |
Request:
GET /seasonality/performance-around-holiday?ticker=SPY&holiday_name=New Year's Day&shift=5&start_year=2006&end_year=2026
Response:
{
    "code": 200,
    "data": {
        "holiday_name": "New Year's Day",
        "shift": 5,
        "data": [
            {
                "DayOffset": -5,
                "Mean_Return": 0.17,
                "Positive_Pct": 75.0
            },
            {
                "DayOffset": -4,
                "Mean_Return": 0.43,
                "Positive_Pct": 70.0
            },
            {
                "DayOffset": -3,
                "Mean_Return": -0.19,
                "Positive_Pct": 40.0
            }
            ...
    ]
  }
}
Response Fields (data object):
| Field | Description |
|---|---|
holiday_name |
Name of the holiday analyzed |
shift |
Days window around the holiday used in the analysis |
data |
Performance data for each day offset |
data[].DayOffset |
Days relative to the holiday (negative = before, 0 = holiday day, positive = after) |
data[].Mean_Return |
Average return (%) at this day offset across all years |
data[].Positive_Pct |
Percentage of times the return was positive (%) |
1.7 Performance Around Specific Days
GET /seasonality/performance-around-specific-days
Performance around a custom date (month + day) each year.
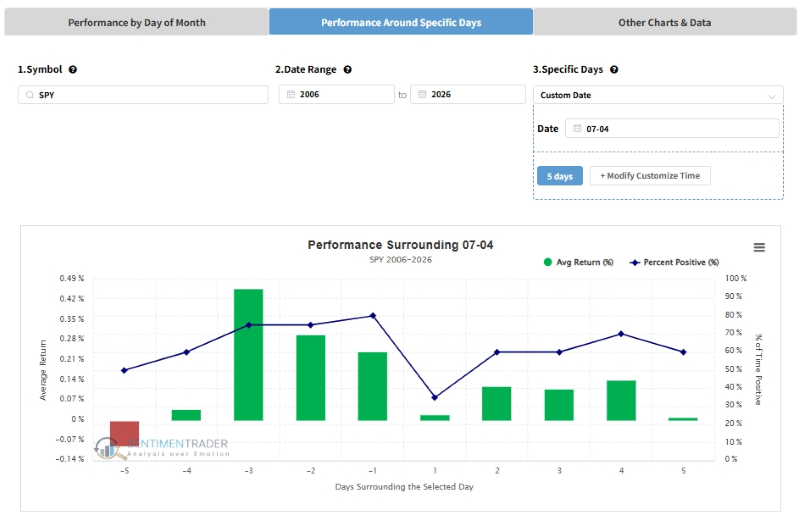
performance-around-specific-days
Extra Parameters:
| Name | Default | Description |
|---|---|---|
| month | current month | Month number (1-12) |
| day | current day | Day number (1-31) |
| shift | 5 | Days window around the date |
Request:
GET /seasonality/performance-around-specific-days?ticker=SPY&month=7&day=4&shift=5&start_year=2006&end_year=2026
Response:
{
    "code": 200,
    "data": {
        "target_date": "07-04",
        "shift": 5,
        "data": [
            {
                "DayOffset": -5,
                "Mean_Return": -0.09,
                "Positive_Pct": 50.0
            },
            {
                "DayOffset": -4,
                "Mean_Return": 0.04,
                "Positive_Pct": 60.0
            },
            {
                "DayOffset": -3,
                "Mean_Return": 0.46,
                "Positive_Pct": 75.0
            }
            ...
    ]
  }
}
Response Fields (data object):
| Field | Description |
|---|---|
target_date |
Target date in "MM-DD" format |
shift |
Days window around the date used in the analysis |
data |
Performance data for each day offset |
data[].DayOffset |
Days relative to the target date (negative = before, 0 = target day, positive = after) |
data[].Mean_Return |
Average return (%) at this day offset across all years |
data[].Positive_Pct |
Percentage of times the return was positive (%) |
1.8 Performance by Day of Single Month
GET /seasonality/performance-by-day-of-single-month
Daily performance breakdown within a specific month.
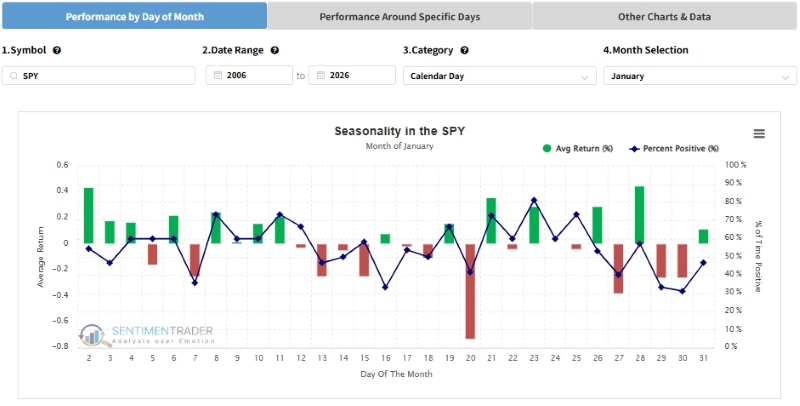
performance-by-day-of-single-month
Extra Parameters:
| Name | Default | Description |
|---|---|---|
| target_month | current month | Month name, e.g. "January" |
| category | calendar_day | calendar_day or trading_day
|
Request:
GET /seasonality/performance-by-day-of-single-month?ticker=SPY&target_month=January&category=calendar_day&start_year=2006&end_year=2026
Response:
{
    "code": 200,
    "data": {
        "month_name": "January",
        "category": "calendar_day",
        "data": [
            {
                "Day": "02",
                "Mean_Return": 0.44,
                "Positive_Pct": 54.55
            },
            {
                "Day": "03",
                "Mean_Return": 0.18,
                "Positive_Pct": 46.67
            },
            {
                "Day": "04",
                "Mean_Return": 0.17,
                "Positive_Pct": 60.0
            }
            ...
    ]
  }
}
Response Fields (data object):
| Field | Description |
|---|---|
month_name |
Target month name |
category |
calendar_day or trading_day |
data |
Daily performance breakdown |
data[].Day |
Day number (zero-padded, e.g. "02") |
data[].Mean_Return |
Average return (%) on this day across all years |
data[].Positive_Pct |
Percentage of times the return was positive (%) |
1.9 One Dollar Curve
GET /seasonality/one-dollar-curve
Growth of $1 invested from a specific trading day each year.
Extra Parameters:
| Name | Default | Description |
|---|---|---|
| entry_day | current year's trading day | Entry trading day of year (1-252) |
| holding_days | 63 | Number of trading days to hold |
| exit_day | entry + holding | Exit trading day (overrides holding_days if set) |
Request:
GET /seasonality/one-dollar-curve?ticker=SPY&holding_days=63&start_year=2006&end_year=2026
Response:
{
    "code": 200,
    "data": {
        "entry_trading_day": 91,
        "exit_trading_day": 154,
        "holding_days": 63,
        "data": [
            {
                "Date": "2006-01-03",
                "Equity": 1.0
            },
            {
                "Date": "2006-01-04",
                "Equity": 1.0
            },
            {
                "Date": "2006-01-05",
                "Equity": 1.0
            }
            ...
    ]
  }
}
Response Fields (data object):
| Field | Description |
|---|---|
entry_trading_day |
Entry trading day of year (1–252) |
exit_trading_day |
Exit trading day of year |
holding_days |
Number of trading days held |
data |
Year-by-year equity curve |
data[].Date |
Date (YYYY-MM-DD) |
data[].Equity |
Cumulative value of $1 invested at entry across all years |
1.10 All-in-One Endpoint
GET /seasonality
Returns all (or selected) features in a single response. Use features param to specify which to include (comma-separated, default:
all).
Extra Parameters:
| Name | Default | Description |
|---|---|---|
| features | all | Comma-separated feature names (see table below) |
| holiday_name | nearest holiday | Holiday name |
| shift | 5 | Days offset |
| target_month | current month | Target month name |
| category | calendar_day | calendar_day / trading_day |
| month | current month | Custom month number |
| day | current day | Custom day number |
| entry_day | current year's day | $1 curve entry trading day |
| holding_days | 63 | $1 curve holding days |
| exit_day | entry + holding | $1 curve exit trading day |
Available Features (feature name matches standalone endpoint path):
| Feature | Endpoint |
|---|---|
performance-by-week |
GET /seasonality/performance-by-week |
performance-by-month |
GET /seasonality/performance-by-month |
performance-around-holiday |
GET /seasonality/performance-around-holiday |
performance-by-day-of-single-month |
GET /seasonality/performance-by-day-of-single-month |
performance-around-specific-days |
GET /seasonality/performance-around-specific-days |
performance-by-day-of-month |
GET /seasonality/performance-by-day-of-month |
performance-by-day-of-year |
GET /seasonality/performance-by-day-of-year |
one-dollar-curve |
GET /seasonality/one-dollar-curve |
Request:
GET /seasonality?ticker=SPY&features=performance-by-week,performance-by-month
Response:
{
    "code": 200,
    "data": {
        "performance-by-week": {
            "meta": {
                "description": "Performance by day of the week"
            },
            "data": [
                {
                    "Weekday": "Monday",
                    "Mean_Return": 0.03,
                    "Positive_Pct": 55.35
                },
                {
                    "Weekday": "Tuesday",
                    "Mean_Return": 0.09,
                    "Positive_Pct": 53.41
                },
                {
                    "Weekday": "Wednesday",
                    "Mean_Return": 0.08,
                    "Positive_Pct": 57.48
                }
                ...
            ]
        },
        "performance-by-month": {
            "meta": {
                "description": "Average performance per month"
            },
            "data": [
                {
                    "MonthName": "January",
                    "Mean_Return": 0.02,
                    "Positive_Pct": 55.42
                },
                {
                    "MonthName": "February",
                    "Mean_Return": 0.01,
                    "Positive_Pct": 56.33
                },
                {
                    "MonthName": "March",
                    "Mean_Return": 0.03,
                    "Positive_Pct": 50.33
                }
                ...
            ]
        }
    }
}
Response Fields (data object):
| Field | Description |
|---|---|
{feature-name} |
Each requested feature is a key (e.g. performance-by-week) |
{feature-name}.meta |
Metadata including a description of the feature |
{feature-name}.data |
Same structure as the standalone endpoint response. See each individual endpoint for field details. |
2. Symbol Correlation
Calculate correlation matrix and rolling correlation between multiple symbols. To view it on our website, please click here.
Endpoint
POST /symbol_corr
application/json)
and Form Data (x-www-form-urlencoded / multipart/form-data).
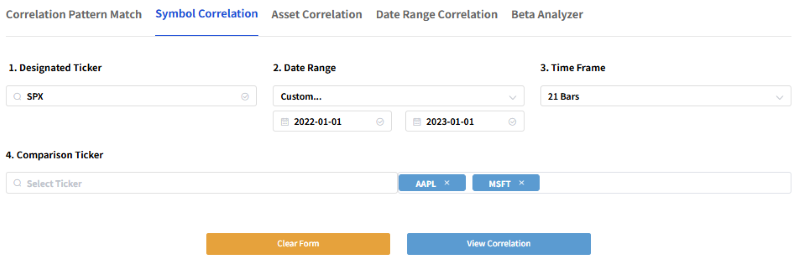
symbol_corr
Request Body (JSON)
{
  "benchmark": "SPX",
  "stock_comparison": ["AAPL", "MSFT"],
  "start_date": "2022-01-01",
  "end_date": "2023-01-01",
  "roll_window": 21
}
Parameters
| Name | Type | Required | Description | Example |
|---|---|---|---|---|
| benchmark | string | Yes | Benchmark symbol | "SPX" |
| stock_comparison | array | Yes | Comparison symbols (JSON array) | ["AAPL", "MSFT"] |
| start_date | string | Yes | Start date (YYYY-MM-DD) | "2022-01-01" |
| end_date | string | Yes | End date (YYYY-MM-DD) | "2023-01-01" |
| roll_window | integer | No | Rolling window (trading days, default: 21) | 21 |
Form Data (Postman Bulk Edit)
benchmark:SPX
stock_comparison:["AAPL","MSFT"]
start_date:2022-01-01
end_date:2023-01-01
roll_window:21
Response Example
{
    "code": 211,
    "data": {
        "corr_matrix": [
            {
                "index": "SPX",
                "SPX": 1.0,
                "AAPL": 0.89,
                "MSFT": 0.88
            },
            {
                "index": "AAPL",
                "SPX": 0.89,
                "AAPL": 1.0,
                "MSFT": 0.82
            },
            {
                "index": "MSFT",
                "SPX": 0.88,
                "AAPL": 0.82,
                "MSFT": 1.0
            }
        ],
        "corr_roll": [
            {
                "Date": "2022-02-02T00:00:00",
                "AAPL": 0.86,
                "MSFT": 0.72,
                "stock_price": 4589.38
            },
            {
                "Date": "2022-02-03T00:00:00",
                "AAPL": 0.86,
                "MSFT": 0.77,
                "stock_price": 4477.44
            },
            {
                "Date": "2022-02-04T00:00:00",
                "AAPL": 0.83,
                "MSFT": 0.75,
                "stock_price": 4500.53
            }
            ...
    ]
  }
}
Response Fields (data object):
| Field | Description |
|---|---|
corr_matrix |
Full correlation matrix. Each object has an index field (row symbol) plus one column per symbol with the correlation value (1.0 = perfect self-correlation). |
corr_matrix[].index |
Row symbol name |
corr_matrix[].{SYMBOL} |
Correlation coefficient (-1 to 1) between index and that symbol |
corr_roll |
Rolling correlation time series |
corr_roll[].Date |
Date (ISO format) |
corr_roll[].{SYMBOL} |
Rolling correlation of that symbol vs the benchmark |
corr_roll[].stock_price |
Benchmark (stock) price on that date |
3. Asset Correlation
Calculate correlation between broad assets. To view it on our website, please click here.
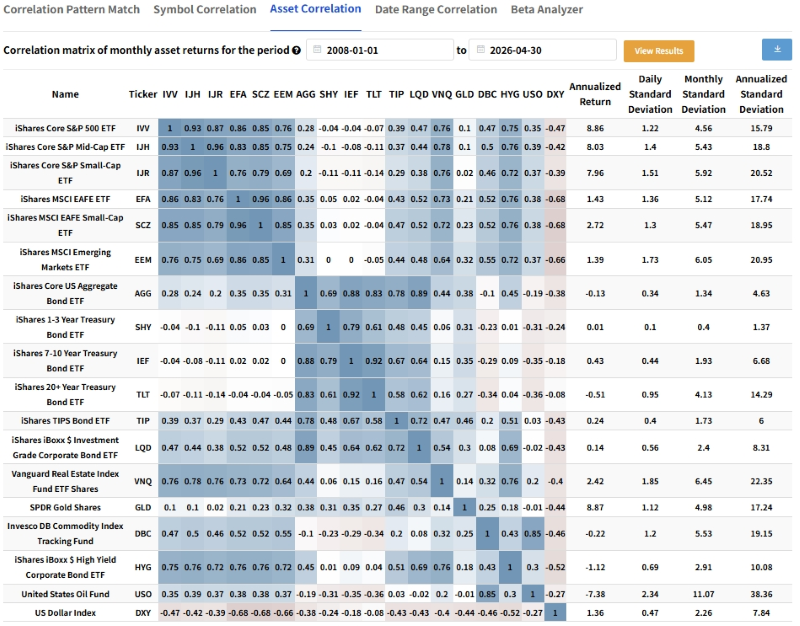
asset_corr
| Symbol | Name |
|---|---|
IVV |
iShares Core S&P 500 ETF |
IJH |
iShares Core S&P Mid-Cap ETF |
IJR |
iShares Core S&P Small-Cap ETF |
EFA |
iShares MSCI EAFE ETF |
SCZ |
iShares MSCI EAFE Small-Cap ETF |
EEM |
iShares MSCI Emerging Markets ETF |
AGG |
iShares Core US Aggregate Bond ETF |
SHY |
iShares 1-3 Year Treasury Bond ETF |
IEF |
iShares 7-10 Year Treasury Bond ETF |
TLT |
iShares 20+ Year Treasury Bond ETF |
TIP |
iShares TIPS Bond ETF |
LQD |
iShares iBoxx $ Investment Grade Corporate Bond ETF |
VNQ |
Vanguard Real Estate Index Fund ETF |
GLD |
SPDR Gold Shares |
DBC |
Invesco DB Commodity Index Tracking Fund |
HYG |
iShares iBoxx $ High Yield Corporate Bond ETF |
USO |
United States Oil Fund |
DXY |
US Dollar Index |
Endpoint
POST /asset_corr
application/json)
and Form Data (x-www-form-urlencoded / multipart/form-data).
Request Body (JSON)
{
  "start_date": "2020-01-01",
  "end_date": "2021-01-01"
}
Parameters
| Name | Type | Required | Description | Example |
|---|---|---|---|---|
| start_date | string | Yes | Start date (YYYY-MM-DD) | "2020-01-01" |
| end_date | string | Yes | End date (YYYY-MM-DD) | "2021-01-01" |
Form Data (Postman Bulk Edit)
start_date:2020-01-01
end_date:2021-01-01
Response Example
{
    "code": 211,
    "data": {
        "start_date": "2020-01-01",
        "end_date": "2021-01-01",
        "corr_info": [...]
  }
}
Response Fields (data object):
| Field | Description |
|---|---|
start_date |
Start date used (YYYY-MM-DD) |
end_date |
End date used (YYYY-MM-DD) |
corr_info |
Correlation data for the 18 broad asset classes. Each entry contains pairwise correlation values among assets (IVV, IJH, IJR, EFA, SCZ, EEM, AGG, SHY, IEF, TLT, TIP, LQD, VNQ, GLD, DBC, HYG, USO, DXY). |
4. Pattern Correlation
Calculate correlation (0-100) between two historical price patterns. To view it on our website, please click here.
Endpoint
POST /pattern_corr
application/json)
and Form Data (x-www-form-urlencoded / multipart/form-data).
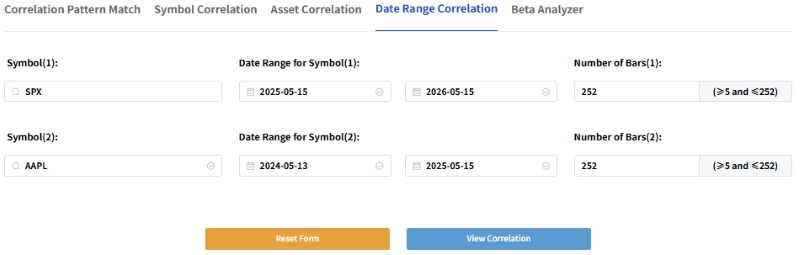
pattern_corr
Request Body (JSON)
{
  "referenceSymbol": "SPX",
  "referenceStartDate": "2024-01-01",
  "referenceEndDate": "2024-12-31",
  "comparisonSymbol": "AAPL",
  "comparisonStartDate": "2025-01-01",
  "comparisonEndDate": "2025-12-31"
}
Parameters
| Name | Type | Required | Description | Example |
|---|---|---|---|---|
| referenceSymbol | string | Yes | Reference symbol | "SPX" |
| referenceStartDate | string | Yes | Reference pattern start date (YYYY-MM-DD) | "2024-01-01" |
| referenceEndDate | string | Yes | Reference pattern end date (YYYY-MM-DD) | "2024-12-31" |
| comparisonSymbol | string | Yes | Comparison symbol | "AAPL" |
| comparisonStartDate | string | Yes | Comparison pattern start date (YYYY-MM-DD) | "2025-01-01" |
| comparisonEndDate | string | Yes | Comparison pattern end date (YYYY-MM-DD) | "2025-12-31" |
Form Data (Postman Bulk Edit)
referenceSymbol:SPX
referenceStartDate:2024-01-01
referenceEndDate:2024-12-31
comparisonSymbol:AAPL
comparisonStartDate:2025-01-01
comparisonEndDate:2025-12-31
Response Example
{
    "code": 211,
    "data": {
        "pattern_corr": 80
    }
}
Response Fields (data object):
| Field | Description |
|---|---|
pattern_corr |
Correlation score (0–100) between the two price patterns. Higher values indicate more similar patterns. |
5. Symbol Beta
Calculate rolling Beta values of symbols vs benchmark.
Deconstruct risk transmission through correlation and rolling volatility data. Gain quantitative perspectives on asset-level risk exposure and strategic hedging. To view it on our website, please click here.
Calculation Methodology
The rolling Beta is computed using its fundamental mathematical components: the rolling Pearson correlation (ρ) multiplied by the ratio of the asset's rolling volatility (σ) to the benchmark's volatility:
Track historical Beta to dynamically classify an asset's behavior as Aggressive (β > 1), Defensive (0 < β < 1), or Inverse (β < 0).
Endpoint
POST /symbol_beta
application/json)
and Form Data (x-www-form-urlencoded / multipart/form-data).
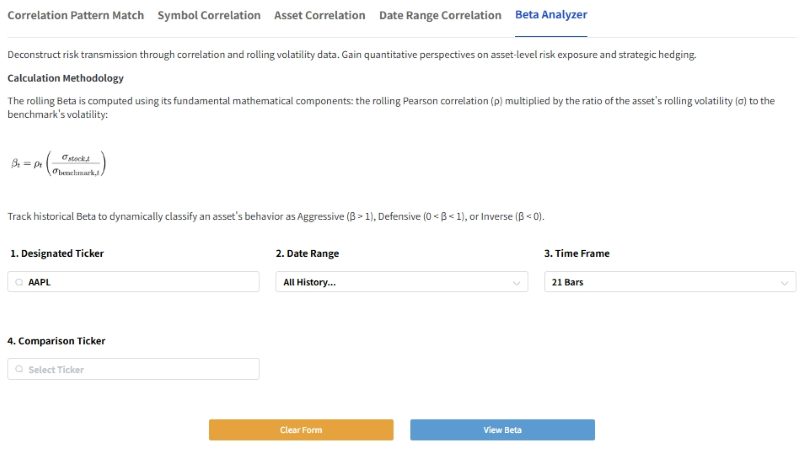
symbol_beta
Request Body (JSON)
{
  "benchmark": "SPX",
  "stock_comparison": ["AAPL"],
  "start_date": "2022-01-01",
  "end_date": "2023-01-01",
  "roll_window": 21
}
Parameters
| Name | Type | Required | Description | Example |
|---|---|---|---|---|
| benchmark | string | Yes | Benchmark symbol | "SPX" |
| stock_comparison | array | Yes | Comparison symbols (JSON array) | ["AAPL"] |
| start_date | string | Yes | Start date (YYYY-MM-DD) | "2022-01-01" |
| end_date | string | Yes | End date (YYYY-MM-DD) | "2023-01-01" |
| roll_window | integer | No | Rolling window (trading days, default: 21) | 21 |
Form Data (Postman Bulk Edit)
benchmark:SPX
stock_comparison:["AAPL"]
start_date:2022-01-01
end_date:2023-01-01
roll_window:21
Response Example
{
    "code": 211,
    "data": {
        "beta_roll": [
            {
                "Date": "2022-02-02T00:00:00",
                "AAPL": 1.48,
                "AAPL_price": 175.84,
                "stock_price": 4589.38
            },
            {
                "Date": "2022-02-03T00:00:00",
                "AAPL": 1.37,
                "AAPL_price": 172.9,
                "stock_price": 4477.44
            },
            {
                "Date": "2022-02-04T00:00:00",
                "AAPL": 1.33,
                "AAPL_price": 172.39,
                "stock_price": 4500.53
            }
            ...
    ]
  }
}
Response Fields (data object):
| Field | Description |
|---|---|
beta_roll |
Rolling beta time series |
beta_roll[].Date |
Date (ISO format) |
beta_roll[].{SYMBOL} |
Rolling beta of the symbol vs the benchmark. >1 = aggressive, 0–1 = defensive, <0 = inverse. |
beta_roll[].{SYMBOL}_price |
Symbol price on that date |
beta_roll[].stock_price |
Benchmark price on that date |
6. CPM (Correlation Pattern Match)
Correlation Pattern Match. Uses pre-defined pattern templates or custom price patterns to find similar historical patterns. Two endpoints available: scan-only (returns matching dates) and full backtest (returns trading results). To view it on our website, please click here.
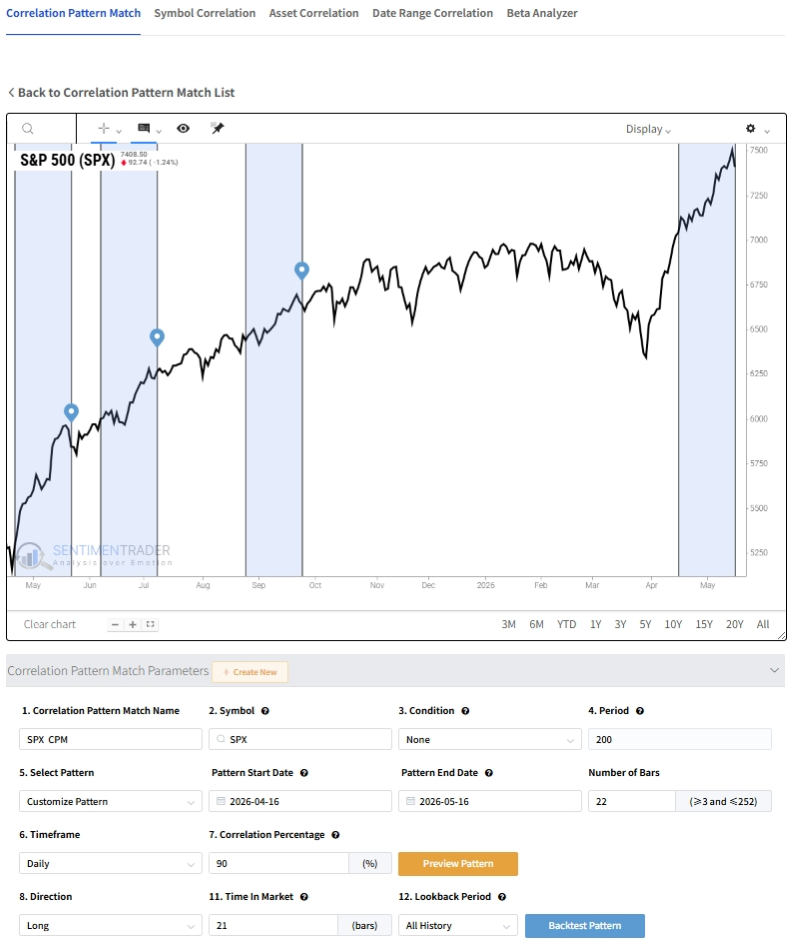
cpm
Common Parameters
Shared between /cpm/scan and /cpm/scan_with_backtest:
| Name | Type | Required | Description | Example |
|---|---|---|---|---|
| symbol | string | Yes | Target ticker symbol | "SPX" |
| corr_per | integer | Yes | Minimum correlation percentage (0-100). Effective range: 75-100. | 90 |
| time_in_market | integer | Yes | Holding bars (days) after pattern match. Range: 3-252. | 21 |
| start_date | string | No | Pattern template start (YYYY-MM-DD). Required in Customize mode. In Common
Pattern mode, defaults to 2026-01-01 if omitted.
|
"2024-12-16" |
| end_date | string | No | Pattern template end (YYYY-MM-DD). Required in Customize mode. In Common
Pattern mode, defaults to 2026-12-31 if omitted.
|
"2025-01-17" |
| timeframe | string | No | Data frequency | Daily, Weekly, Monthly (default: Daily)
|
| lookback_period | string | No | Historical lookback range (years). All for entire history. |
20, 10, All (default: 20)
|
| ma | integer | No | Moving average period. Only effective when ma_condition != 0.
Range: 1-252.
|
200 |
| ma_condition | integer | No | Moving average filter | 0 (None), 1 (Close > MA),
2 (Close < MA). Default: 0
|
| direction | string | No | Trade direction | Long (default), Short |
| system_pattern | string | No | Pre-defined pattern template. When set, start_date and end_date are ignored.
|
head_and_shoulder_bottom |
| exclude_overlap | integer | No | Exclude overlapping signals | 1 (exclude, default), 0 (keep)
|
| name | string | No | Backtest identifier name (only used in full backtest) | "" |
Two Pattern Modes
Customize Mode (default)
- Do not set system_pattern
- Must provide start_date and end_date - the engine extracts the price pattern from this date range and
scans for similar patterns
Common Pattern (system preset)
- Set system_pattern to one of the pre-defined
patterns below
- start_date and end_date are ignored
Predefined Patterns
| Pattern | Name |
|---|---|
head_and_shoulder_top |
Head and Shoulders Top |
head_and_shoulder_bottom |
Head and Shoulders Bottom |
double_top |
Double Top |
double_bottom |
Double Bottom |
triple_tap |
Triple Tap |
rounding_bottom |
Rounding Bottom |
ascending_channel |
Ascending Channel |
descending_channel |
Descending Channel |
Get Predefined Patterns
GET /cpm/get-predefined-patterns
Response:
{
    "patterns": [
        "head_and_shoulder_top",
        "head_and_shoulder_bottom",
        "double_top",
        "double_bottom",
        "triple_tap",
        "rounding_bottom",
        "ascending_channel",
        "descending_channel"
    ]
}
For longer-running backtests, use the async workflow: submit → poll → retrieve.
Submit Backtest Job
POST /cpm/backtest/start
Accepts the same parameters as Common Parameters.
Returns immediately with a task_id.
Request Body (JSON):
{
  "symbol": "SPX",
  "corr_per": 90,
  "time_in_market": 21,
  "system_pattern": "head_and_shoulder_bottom",
  "timeframe": "Daily",
  "lookback_period": "20",
  "ma": 200,
  "ma_condition": 0,
  "direction": "Long",
  "exclude_overlap": 1
}
Response (202):
{
    "task_id": "a1b2c3d4-e5f6-7890-abcd-ef1234567890",
    "message": "CPM backtest task created successfully"
}
Response Fields:
| Field | Description |
|---|---|
task_id |
Unique task identifier (UUID). Use this to poll status via GET /cpm/status/{task_id}. |
message |
Confirmation message |
Submit Scan Job
POST /cpm/scan/start
Accepts the same parameters as Common Parameters with scan mode.
Response (202):
{
    "task_id": "a1b2c3d4-e5f6-7890-abcd-ef1234567890",
    "message": "CPM scan task created successfully"
}
Get Task Status
GET /cpm/status/{task_id}
Poll task status. Works for both backtest and scan tasks.
Response (Backtest mode):
{
    "status": "SUCCESS",
    "username": "[email protected]",
    "created_at": "2026-07-14T01:19:56.599848",
    "params": "{\"symbol\": \"SPX\", \"corr_per\": 90, \"mode\": \"backtest\", ...}",
    "result": {
        "code": 200,
        "msg": "Finish CPM!",
        "data": {
            "count": 24,
            "patterns": [
                {
                    "StartDate": "2009-02-24",
                    "EndDate": "2009-03-18",
                    "Corr": 91,
                    "Close": 794.35,
                    "BarsNum": 17
                }
            ],
            "backtest_info": {
                "TOTAL RETURN": 34.41,
                "MEDIAN RETURN": 1.56,
                "AVERAGE RETURN": 1.43,
                "WIN RATE": 66.67,
                "AVERAGE WIN": 3.62,
                "AVERAGE LOSS": -2.95,
                "TOTAL TRADES": 24,
                "TOTAL POSITIVE": 16,
                "TOTAL NEGATIVE": 8,
                "BUY & HOLD": 492.32,
                "TIME IN MARKET": 9.76,
                "trades": [
                    {
                        "StartDate": "2009-02-24",
                        "EndDate": "2009-03-18",
                        "Correlation Percentage": 91,
                        "Close": 794.35,
                        "BarsNum": 17,
                        "EachReturn": 9.47,
                        "ExitDate": "2009-04-17",
                        "ExitPrice": 869.6,
                        "MaxGain": 9.47,
                        "MaxLoss": -3.25,
                        "MarketCondition": ["Bull", "Rec"]
                    }
                ]
            }
        },
        "task_id": "a1b2c3d4-e5f6-7890-abcd-ef1234567890"
    }
}
Response (Scan mode):
{
    "status": "SUCCESS",
    "username": "[email protected]",
    "created_at": "2026-07-14T01:19:10.037986",
    "params": "{\"symbol\": \"SPX\", \"corr_per\": 90, \"mode\": \"scan\", ...}",
    "result": {
        "code": 200,
        "msg": "Found matching patterns!",
        "data": {
            "count": 24,
            "patterns": [
                {
                    "StartDate": "2009-02-24",
                    "EndDate": "2009-03-18",
                    "Corr": 91,
                    "Close": 794.35,
                    "BarsNum": 17
                },
                {
                    "StartDate": "2009-09-22",
                    "EndDate": "2009-10-14",
                    "Corr": 91,
                    "Close": 1092.02,
                    "BarsNum": 17
                }
            ]
        },
        "task_id": "a1b2c3d4-e5f6-7890-abcd-ef1234567890"
    }
}
Scan Mode Data Fields
Scan mode returns count and a patterns array:
| Field | Description |
|---|---|
count | Total number of matching patterns found |
patterns[].StartDate | Pattern start date (YYYY-MM-DD) |
patterns[].EndDate | Pattern end date (YYYY-MM-DD) |
patterns[].Corr | Correlation percentage (0–100) |
patterns[].Close | Close price at pattern end |
patterns[].BarsNum | Number of bars in the pattern |
Backtest Mode Data Fields
Backtest mode returns count, patterns, and backtest_info with summary stats + trades:
| Field | Description |
|---|---|
count | Total number of matching patterns |
patterns | Pattern match results (same structure as scan mode) |
backtest_info.TOTAL RETURN | Total portfolio return (%) |
backtest_info.MEDIAN RETURN | Median per-trade return (%) |
backtest_info.AVERAGE RETURN | Average per-trade return (%) |
backtest_info.WIN RATE | Percentage of profitable trades (%) |
backtest_info.AVERAGE WIN | Average winning trade return (%) |
backtest_info.AVERAGE LOSS | Average losing trade return (%) |
backtest_info.TOTAL TRADES | Total number of trades |
backtest_info.TOTAL POSITIVE | Number of winning trades |
backtest_info.TOTAL NEGATIVE | Number of losing trades |
backtest_info.BUY & HOLD | Buy & hold benchmark return (%) |
backtest_info.TIME IN MARKET | Percentage of time with open positions (%) |
backtest_info.trades | Per-trade details. See Trade Object Fields below. |
Trade Object Fields (backtest_info.trades[])
| Field | Description |
|---|---|
StartDate | Pattern start date (YYYY-MM-DD) |
EndDate | Pattern end date (YYYY-MM-DD) |
Correlation Percentage | Correlation percentage (rounded to 4 decimals) |
Close | Close price at pattern end |
BarsNum | Number of bars in the pattern |
EachReturn | Per-trade return (%) |
ExitDate | Trade exit date (YYYY-MM-DD) |
ExitPrice | Trade exit price |
MaxGain | Maximum gain during the trade (%) |
MaxLoss | Maximum loss during the trade (%) |
MarketCondition | Market conditions (e.g. ["Bull", "Rec"]) |
Response Fields:
| Field | Description |
|---|---|
status |
Task status: PENDING, RUNNING, SUCCESS, or FAILED |
username |
Email of the user who submitted the task |
created_at |
Task creation timestamp (ISO format) |
params |
JSON-encoded string of the original request parameters |
result |
Present only when status is SUCCESS. Contains msg, code, data, and task_id. See Scan Mode Data Fields or Backtest Mode Data Fields above for the data structure. |
Task Status Values:
GET /cpm/tasks?status=PENDING&mode=scan&limit=20&offset=0
List tasks for the authenticated user.
Query Parameters:
| Name | Required | Description |
|---|---|---|
| status | No | Filter by status: PENDING, RUNNING, SUCCESS, FAILED |
| mode | No | Filter by mode: backtest, scan
|
| limit | No | Max tasks to return (default 20, max 200) |
| offset | No | Pagination offset (default 0) |
Response:
{
    "tasks": [
        {
            "task_id": "a1b2c3d4-e5f6-7890-abcd-ef1234567890",
            "status": "SUCCESS",
            "mode": "backtest",
            "symbol": "SPX",
            "system_pattern": "head_and_shoulder_bottom",
            "created_at": "2025-06-25T10:30:00.000000"
        }
    ],
    "total": 42,
    "limit": 20,
    "offset": 0
}
Response Fields:
| Field | Description |
|---|---|
tasks |
List of task summary objects |
tasks[].task_id |
Task UUID |
tasks[].status |
Task status |
tasks[].mode |
Task mode: backtest or scan |
tasks[].symbol |
Target symbol |
tasks[].system_pattern |
Pattern name used (if any) |
tasks[].created_at |
Creation timestamp |
total |
Total number of tasks matching filters |
limit |
Max tasks returned per page |
offset |
Pagination offset |
7. Smart Stock Scanner
Get latest AI Scanner picks, signals, and backtest information. To view it on our website, please click here.
Our Smart Stock Scanner is updated nightly by 11:40 PM Eastern Time. This system is designed to provide you with a list of stocks that have triggered a "Signal-for-Action", worthy of consideration for trading at the opening of the next market day. Currently, our system can scan the 1500 S&P stocks. We will announce when additional stocks from other market indices are included.
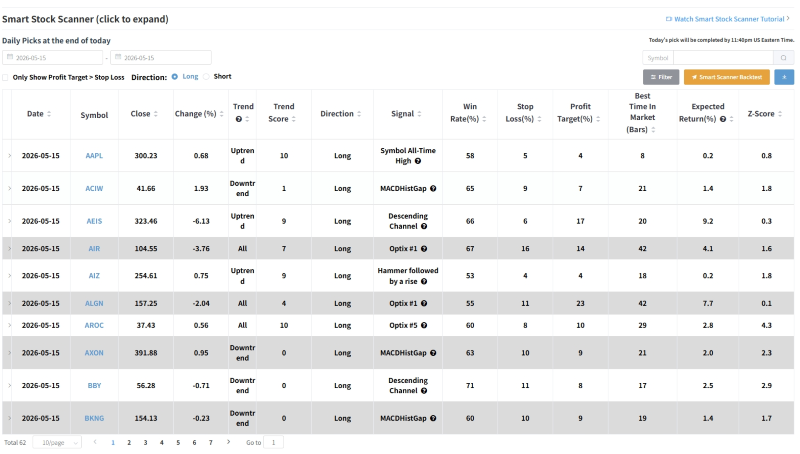
scanner
7.1 Get Predefined Signals
GET /smart-stock-scanner/get-predefined-signals
Returns all available scanner signals with names, descriptions, and categories.
Response Example
{
    "code": 200,
    "data": {
        "signals": [
            {"name": "MA", "category": "Technical Indicator", "description": "..."},
            {"name": "RSI", "category": "Technical Indicator", "description": "..."},
            ...
        ],
        "categories": {
            "Technical Indicator": [{"name": "MA", "description": "..."}, ...],
            "Candlestick Pattern": [...],
            "Optix Signal": [...],
            "CPM Pattern": [...],
            "High/Low Signal": [...],
            "Trend Score": [...]
        }
    }
}
Response Fields (data object):
| Field | Description |
|---|---|
signals |
Flat list of all available signals, each with name, category, and description |
categories |
Signals grouped by category. Keys are category names; values are arrays of {name, description} objects. |
7.2 Signal Descriptions
Technical Indicators (8):
- MA - This strategy utilizes the crossover of
Symbol Closes and moving averages as trading signals. It can further specify the direction of trades and
operating rules, such as determining long signals after a golden cross.
- MAGap - This strategy determines trading signals
by comparing the difference between the moving average of the current day and the previous day. It can
further specify the direction of trades and operating rules, such as determining long signals after a
golden cross.
- MACDHist - This strategy uses the crossover
signals of the MACD histogram as trading signals. It can further specify the direction of trades and
operating rules, such as determining long signals after a golden cross.
- MACDHistGap - This strategy determines trading
signals by comparing the difference between the MACDHist and the previous day's value. It can further
specify the direction of trades and operating rules, such as determining long signals after a golden
cross and short signals after a death cross.
- RSI - When the RSI indicator forms a golden cross
above 35, it suggests that the indicator is about to recover from an oversold state to the midpoint,
indicating a potential long signal. RSI can reflect whether a stock is in an overbought or oversold
condition but should be used in conjunction with the trend analysis.
- PriceBreakout - When the Symbol Close of a stock
ranks above 0 in relation to the Symbol Closes of the past 21 trading days, a golden cross occurs,
indicating an upward breakout and generating a long signal. This suggests that the stock's price has
entered a breakout phase and is likely to continue rising.
- HighPoints - When the highest price of a stock
ranks above 100 in relation to the highest prices of the past 13 trading days (higher stock prices
correspond to higher rankings), it forms a 13-day new high and generates a long signal. This indicates
that the stock is experiencing a positive breakthrough and is in an upward trend.
- LowPoints - When the lowest price of a stock
ranks below 0 in relation to the lowest prices of the past 13 trading days, it forms a 13-day new low
and generates a short signal. This indicates that the stock is in a downtrend and can be shorted.
Candlestick Patterns (4):
- Hammer followed by a rise - If the previous day's
candlestick shows a long lower shadow, indicating support at the bottom, a long signal is generated when
the price rises above a certain threshold after the opening.
- Shooting Star followed by a fall - If the
previous day's candlestick shows a long upper shadow, indicating resistance at the top, a short signal
is generated when the price falls below a certain threshold after the opening.
- UpTrend Pattern -
- DownTrend Pattern -
Optix Signals (7):
- Optix #1 - Symbol Close > its' MA200 and Optix
MA5 < 35
- Optix #2 - Symbol Close > its' MA200 and Optix <
30
- Optix #3 - Optix MA10 < 30 and Optix < 20
- Optix #4 - Optix CrossBelow 0.5
- Optix #5 - Symbol Close > MA200 and Optix MA5 >
43 After Below 35
- Optix #6 - Symbol Close > MA200 and Optix MA10 >
43 After Below 35
- Optix #7 - Symbol Close > MA200 and Optix > 43
After Below 30
CPM Patterns (8):
- Head and Shoulders Top - The stock price rises
from the left shoulder to a peak, falls back to the support level, then rises higher to form a head, and
then falls back to the support level again. Afterwards, the price rises to the height of the left
shoulder to form the right shoulder, followed by a significant decline, breaking through the bottom of
the pattern and continuing to decline. Head and shoulders tops are typical bear market signals.
- Head and Shoulders Bottom - Usually formed after
a sharp market decline, indicating a market reversal. The pattern consists of the left shoulder, head,
right shoulder, and neckline. The middle valley (head) is the deepest, while the front and back valleys
(left and right shoulders) are shallower and almost symmetrical, forming a head and shoulders bottom
shape.
- Double Top - Composed of two similar high points,
shaped like the letter 'M'. The formation of a double top pattern is a reversal signal, indicating that
prices will fall.
- Double Bottom - Also known as a W bottom, formed
when the low points of a stock price's two consecutive declines are roughly the same. It is a bullish
reversal pattern.
- Triple Tap - Triple Tap refers to a scenario
where stocks or other assets exhibit repeated bounces off the support line (the lower boundary of the
price range). This pattern is often seen as a positive signal that stock prices are experiencing strong
buying support near the support line. By observing this pattern, investors may perceive the support line
as an important price level that may have a positive impact on prices and may be a suitable buying
opportunity.
- Rounding Bottom - Rounding bottom is a chart
pattern that's used in technical analysis. It's identified by a series of price movements that
graphically form the shape of a 'U'. Rounding bottoms are found at the end of extended downward trends
and signify a reversal in long-term price movements.
- Ascending Channel - Ascending channel is the
price action contained between upward sloping parallel lines. Higher highs and higher lows characterize
this price pattern. Before traders take a short position when price breaks below the lower channel line
of an ascending channel, they should look for other signs that show weakness in the pattern.
- Descending Channel - Descending channel is a
chart pattern that indicates a downward trend in a security's price. Visually, a descending channel
angles downward, from a high point to a lower point. The idea behind the descending channel is that once
established, it may signify a continuation of lower high and low prices. Once the trendlines are solid
and extended, traders can get a sense of points of price support and resistance.
High/Low Signals (8):
- Symbol All-Time High - Symbol All-Time High is
the highest Symbol Close a symbol has reached in its trading history. Symbols that hit all-time high are
often viewed as positive indicators, as it shows that investor confidence and demand for the symbol is
continuing to grow.
- Symbol All-Time Low - Symbol All-Time Low refers
to the lowest Symbol Close the symbol has ever traded at over its entire history. It indicates the
symbol has lost significant value compared to its past performance. Investors view all-time low as a
sign of deep trouble.
- Symbol 52-Week High - Symbol 52-Week High is the
highest Symbol Close at which a symbol has traded in the last 52-Week (1 year). A symbol hitting a new
52-week high is often seen as a positive technical indicator that the symbol is gaining momentum and is
in an uptrend.
- Symbol 52-Week Low - Symbol 52-Week Low is the
lowest Symbol Close at which a symbol has traded in the past 52-Week (1 year). Symbols trading at or
near 52-week lows are generally considered to be in a downtrend or under significant selling pressure.
52-week lows can trigger technical sell signals and further downward momentum as investors try to cut
their losses.
- Symbol 4-Week High - Symbol 4-Week High refers to
the highest Symbol Close at which a symbol has traded in the last 4-Week (1 month). It is a shorter-term
technical indicator that gives an idea of a symbol's recent price performance. Symbols that make new
four-week highs are often seen as having positive short-term momentum because they are trading at the
highest price levels of the past month.
- Symbol 4-Week Low - Symbol 4-Week Low is the
lowest Symbol Close at which a symbol has traded in the past 4-Week (1 month). Tracking whether a symbol
is near its 4-week low gives an idea of how weak the symbol's recent price has been compared to the past
month. Symbols trading at or near 4-week lows are usually considered to be under short-term selling
pressure or in a recent downtrend.
- Symbol 13-Week High - Symbol 13-Week High is the
highest Symbol Close at which a symbol has traded in the past 13-Week (3 months). Symbols that make new
13-week high are often seen as having positive medium-term momentum because they are trading at their
highest levels of the past quarter. A new 13-week high can be a bullish signal that a symbol is in an
uptrend.
- Symbol 13-Week Low - Symbol 13-Week Low refers to
the lowest Symbol Close a symbol has traded at over the past 13-Week (3 months). Symbols trading at or
near their 13-week lows are often seen as being in a medium-term downtrend or under selling pressure.
The 13-week low gives a longer-term view on a symbol's recent price weakness. Hitting a new 13-week low
can be a bearish signal, suggesting the symbol is in a downward trend.
Trend Score (2):
- Trend Score Breakout - Signal triggers when the
Score rises above 7, indicating a high-conviction bullish trend.
- Trend Score Breakdown - Signal triggers when the
Score falls below 3, indicating a high-conviction bearish trend.
7.3 Single Ticker Scanner
GET /smart-stock-scanner/single/{ticker}
Get AI Scanner picks for a single ticker. Backtest info is optional.
Path Parameters
| Name | Type | Required | Description | Example |
|---|---|---|---|---|
| ticker | string | Yes | Stock symbol | AAPL |
Query Parameters
| Name | Type | Required | Description | Example |
|---|---|---|---|---|
| start_date | string | No | Filter start date (optional, default: latest day) | "2025-01-01" |
| end_date | string | No | Filter end date (optional) | "2025-06-01" |
| include_backtest | boolean | No | Include backtest info (default: false) | false |
Response Example (with backtest)
{
    "code": 200,
    "data": {
        "as_of_date": "2026-05-15",
        "ticker": "AAPL",
        "scanner_data": [
            {
                "Date": "2026-05-15",
                "Symbol": "AAPL",
                "Close": 300.23,
                "Direction": "Long",
                "_Signal": "Symbol All-Time High",
                "WinRate": "58",
                "TimeInMarket": "8",
                "ProfitTarget": "4",
                "StopLoss": "5",
                "AvgWin": 4.13,
                "AvgLoss": 2.84,
                "TradeNumber": 72,
                "Z_Score": 0.82,
                "ExpectedReturn": 0.22,
                "AnnualReturn": 2.86,
                "MedianReturn": 0.81,
                "AvgReturn": 0.45,
                "StdDev": 3.63,
                "MaxRisk": 17.51,
                "SharpeRatio": 0.25,
                "TrendScore": 10,
                "RelTrendScore": 10,
                "Optix": 72.0952,
                "backtest_info": {
                    "date": "2026-05-15",
                    "Direction": "Long",
                    "Symbol": "AAPL",
                    "_Signal": "Symbol All-Time High",
                    "Market": "Uptrend",
                    "AnnualReturn": 2.86,
                    "TradeNumber": 72,
                    "AvgWin": 4.13,
                    "AvgLoss": 2.84,
                    "WinRate": 58.0,
                    "MedianReturn": 0.81,
                    "AvgReturn": 0.45,
                    "Z_Score": 0.82,
                    "StdDev": 3.63,
                    "MaxRisk": 17.51,
                    "TimeInMarket": 8.0,
                    "Close": 300.23,
                    "EachReturn": [1.2, 3.5, -2.1, ...],
                    "EntryTradeDate": ["2016-01-05", "2016-03-10", ...],
                    "ExitTradeDate": ["2016-01-13", "2016-03-22", ...],
                    "EntryTradePrice": [105.2, 101.5, ...],
                    "ExitTradePrice": [106.5, 105.1, ...],
                    "ExitReason": ["Time Is Up", "Profit Target", ...]
                }
            }
        ]
    }
}
Response Fields — Scanner Data Item:
| Field | Description |
|---|---|
Date | Signal date (YYYY-MM-DD) |
Symbol | Ticker symbol |
Close | Closing price on signal date |
Direction | Trade direction: Long or Short |
_Signal | Signal name that triggered (see 7.2 for full list) |
WinRate | Historical win rate (%) for this signal |
ProfitTarget | Profit target (%) |
StopLoss | Stop loss (%) |
TimeInMarket | Suggested holding period (trading days) |
AvgWin | Historical average winning return (%) |
AvgLoss | Historical average losing return (%) |
AvgReturn | Average return per trade (%) |
MedianReturn | Median return per trade (%) |
AnnualReturn | Annualized return (%) |
StdDev | Standard deviation of returns (%) |
MaxRisk | Maximum historical drawdown (%) |
SharpeRatio | Sharpe ratio (risk-adjusted return) |
TradeNumber | Number of historical trades used for statistics |
Z_Score | Z-score (risk-adjusted signal quality) |
ExpectedReturn | Expected return per trade (%) |
TrendScore | Trend score (0–10, higher = stronger trend) |
RelTrendScore | Relative trend score vs peers (0–10) |
Optix | Optix value (proprietary market timing indicator) |
backtest_info |
Present only when include_backtest=true. Contains: date, Direction, Symbol, _Signal, Market, AnnualReturn, TradeNumber, AvgWin, AvgLoss, WinRate, MedianReturn, AvgReturn, Z_Score, StdDev, MaxRisk, TimeInMarket, Close, plus per-trade arrays: EachReturn, EntryTradeDate, ExitTradeDate, EntryTradePrice, ExitTradePrice, ExitReason. |
include_backtest=true, each item also
includes a backtest_info field.
7.4 All Tickers Latest Day Scanner
GET /smart-stock-scanner/latest-day-all
Get AI Scanner picks for all tickers on the latest trading day. Backtest info is optional.
Query Parameters
| Name | Type | Required | Description | Example |
|---|---|---|---|---|
| ticker | string | No | Filter by single ticker (optional, returns all if omitted) | "SPY" |
| date | string | No | Specific date (optional, default: latest day) | "2025-05-12" |
| category | string | No | AI category: SwingAI / MidTermAI (default: SwingAI) | "SwingAI" |
| include_backtest | boolean | No | Include backtest info (default: false) | false |
Response Example (default: no backtest)
{
    "code": 200,
    "data": {
        "as_of_date": "2026-05-13",
        "tickers": [
            "AAPL",
            "AIR",
            "ALGN"
            ...
        ],
        "count": 62,
        "scanner_data": [
            {
                "Date": "2026-05-13",
                "Symbol": "AAPL",
                "Close": 298.87,
                "Direction": "Long",
                "_Signal": "MACDHistGap",
                "WinRate": "56",
                "TimeInMarket": "19",
                "ProfitTarget": "6",
                "StopLoss": "4",
                "AvgWin": 6.24,
                "AvgLoss": 4.92,
                "TradeNumber": 142,
                "Z_Score": 2.28,
                "ExpectedReturn": 1.6,
                "AnnualReturn": 7.32,
                "MedianReturn": 1.7,
                "AvgReturn": 0.83,
                "StdDev": 5.28,
                "MaxRisk": 30.34,
                "SharpeRatio": 0.44,
                "TrendScore": 9,
                "RelTrendScore": 8,
                "Optix": 80.0549
            }
            ...
        ]
    }
}
Response Fields (data object):
| Field | Description |
|---|---|
as_of_date |
Trading date for the results (YYYY-MM-DD) |
tickers |
List of ticker symbols with signals |
count |
Number of tickers with signals |
scanner_data |
Array of scanner result objects (same field structure as 7.3) |
include_backtest=true, each item also
includes a backtest_info field.
8. Smart Scanner Backtest
AI Scanner signal backtest engine. Scans for trading signals, filters candidates, and runs backtests on matched trades. To view it on our website, please click here.
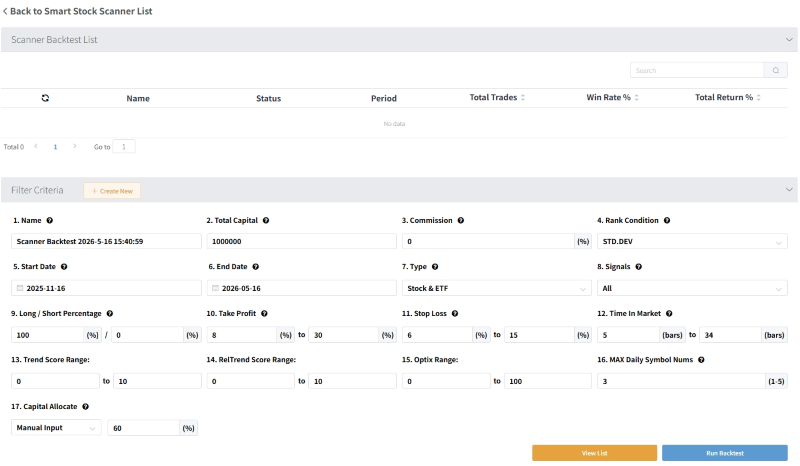
scanner-backtest
For backtests, use the async workflow: submit → poll → retrieve.
Parameters
| Name | Type | Required | Description | Example |
|---|---|---|---|---|
| start_date | string | Yes | Backtest start date (YYYY-MM-DD) | "2025-10-23" |
| end_date | string | Yes | Backtest end date (YYYY-MM-DD) | "2026-04-23" |
| find_type | string | Yes | Security type to scan. Use "/" to combine multiple. | stock/etf |
| signals | array | Yes | Signal filters. ["All"] enables all signals. |
["All"] |
| total_capital | float | Yes | Total portfolio capital | 1000000 |
| long_short_ratio | string | Yes | Long/short allocation, format: long/short |
1.0/0.0 |
| commission | float | No | Commission percentage (default: 0) | 0.0 |
| name | string | No | Backtest name | "test" |
| profit_target_range | string | No | Take profit range, format: min-max |
8-30 |
| stop_loss_range | string | No | Stop loss range, format: min-max |
6-15 |
| time_in_market_range | string | No | Holding period range, format: min-max |
5-34 |
| trend_range | string | No | TrendScore filter range, format: min-max |
0-10 |
| reltrend_range | string | No | RelTrendScore filter range, format: min-max |
0-10 |
| optix_range | string | No | Optix filter range, format: min-max |
0-100 |
| capital_allocate | string | No | Capital allocation: Kelly or fixed ratio |
Kelly |
| daily_limit | integer | No | Maximum trades per day (default: 3) | 3 |
| rank_condition | string | No | Daily sorting metric (default: StdDev) |
StdDev |
start_date, end_date, find_type, signals, total_capital, and long_short_ratio are required. All other parameters are optional.
Parameter Details
rank_condition: WinRate | Z_Score | StdDev | Expected Return | SharpeRatio
find_type: stock | etf | stock/etf (use "/" to combine)
signals: JSON array of signal names. ["All"]
means all signals enabled. See Smart Stock Scanner → Signal
Descriptions for the full list.
Risk Control: profit_target_range
/ stop_loss_range / time_in_market_range — format: "min-max"
long_short_ratio: "long/short",
e.g. "1.0/0.0" means 100% long
capital_allocate: Kelly (default)
or a fixed ratio like 0.6
Submit Job
POST /smart-scanner-backtest/start
Accepts the parameters listed below. Returns immediately with a task_id.
Request Body (JSON):
{
  "name": "test_backtest",
  "total_capital": 1000000,
  "commission": 0.0,
  "rank_condition": "StdDev",
  "start_date": "2026-03-23",
  "end_date": "2026-04-23",
  "find_type": "stock/etf",
  "signals": ["All"],
  "long_short_ratio": "1.0/0.0",
  "profit_target_range": "8-30",
  "stop_loss_range": "6-15",
  "time_in_market_range": "5-34",
  "trend_range": "0-10",
  "reltrend_range": "0-10",
  "optix_range": "0-100",
  "daily_limit": 3,
  "capital_allocate": "Kelly"
}
Response (202):
{
    "task_id": "a1b2c3d4-e5f6-7890-abcd-ef1234567890",
    "message": "Scanner task created successfully"
}
Response Fields:
| Field | Description |
|---|---|
task_id |
Unique task identifier (UUID). Use with GET /smart-scanner-backtest/status/{task_id}. |
message |
Confirmation message |
Get Task Status
GET /smart-scanner-backtest/status/{task_id}
Poll task status after submitting a job.
Response:
{
    "status": "SUCCESS",
    "username": "[email protected]",
    "created_at": "2026-07-14T01:15:07.326678",
    "params": "{\"start_date\": \"2026-01-23\", \"end_date\": \"2026-04-23\", \"find_type\": \"stock/etf\", ...}",
    "result": {
        "code": 200,
        "msg": "Finish Scanner trader!",
        "data": {
            "TOTAL RETURN": 4.55,
            "MEDIAN RETURN": 6.01,
            "AVERAGE RETURN": 0.02,
            "WIN RATE": 58.6,
            "AVERAGE WIN": 8.08,
            "AVERAGE LOSS": -2.31,
            "MAX RISK": -6.01,
            "TOTAL TRADES": 186,
            "TOTAL POSITIVE": 109,
            "TOTAL NEGATIVE": 77,
            "TIME IN MARKET": 71.55,
            "STD.DEV": 8.18,
            "Z-SCORE": 7.56,
            "BUY and HOLD": 8.67,
            "AVERAGE POSITION": 296636.53,
            "TRADE LIST": "[{\"Date\":\"2026-01-23\",\"Symbol\":\"CENX\",\"Close\":48.71,...}]",
            "result": {
                "Start Date": ["2026-01-23", "2026-01-23", ...],
                "Symbol": ["CENX", "ADSK", ...],
                "Signal": [...],
                "Direction": [...],
                "TimeInMarket": [...],
                "ProfitTarget": [...],
                "StopLoss": [...],
                "Kelly": [...],
                "StayInMarket": [...],
                "Shares": [...],
                "Price": [...],
                "Close": [...],
                "FloatProfit": [...],
                "OrderStatus": [...],
                "Action": [...]
            }
        },
        "task_id": "a1b2c3d4-e5f6-7890-abcd-ef1234567890"
    }
}
Task Status Values:
| Status | Description |
|---|---|
PENDING |
Task waiting to be processed |
RUNNING |
Task is being processed |
SUCCESS |
Task completed successfully |
FAILED |
Task encountered an error |
Response Fields:
| Field | Description |
|---|---|
status |
Task status: PENDING, RUNNING, SUCCESS, or FAILED |
username |
Email of the user who submitted the task |
created_at |
Task creation timestamp (ISO format) |
params |
JSON-encoded string of the original request parameters |
result |
Present only when status is SUCCESS. Contains msg, code, data, and task_id. See Scanner Backtest Result Fields below for the data structure. |
Scanner Backtest Result Fields (result.data, returned when task status is SUCCESS)
| Field | Description |
|---|---|
TOTAL RETURN | Total portfolio return (%) over the backtest period |
MEDIAN RETURN | Median per-trade return (%) |
AVERAGE RETURN | Average per-trade return (%) |
WIN RATE | Percentage of profitable trades (%) |
AVERAGE WIN | Average winning trade return (%) |
AVERAGE LOSS | Average losing trade return (%) |
MAX RISK | Maximum portfolio drawdown (%) |
TOTAL TRADES | Total number of closed trades |
TOTAL POSITIVE | Number of winning trades |
TOTAL NEGATIVE | Number of losing trades |
TIME IN MARKET | Percentage of time the strategy had open positions (%) |
STD.DEV | Standard deviation of per-trade returns (%) |
Z-SCORE | Z-score |
BUY and HOLD | Buy & hold benchmark return (%) for the same period |
AVERAGE POSITION | Average portfolio market value |
TRADE LIST | JSON string of scanner list records for backtesting. Each record contains the fields listed in TRADE LIST Item Fields below. |
result | Dict of parallel arrays with per-bar trade records. Each key maps to an array of equal length. See result Sub-Fields below. |
TRADE LIST Item Fields
Each element in the TRADE LIST JSON array represents one scanner signal with its metrics:
| Field | Description |
|---|---|
Date | Signal date (YYYY-MM-DD) |
Symbol | Ticker symbol |
Close | Close price on signal date |
Direction | Trade direction, e.g. "Long" |
Signal | Signal name that triggered the scan |
ProfitTarget | Take-profit percentage |
StopLoss | Stop-loss percentage |
TimeInMarket | Holding period in days |
WinRate | Historical win rate of this signal (%) |
Kelly | Kelly criterion allocation factor |
Expected Return(%) | Expected return percentage |
Optix | Optix value |
TrendScore | Trend score (0–10) |
RelTrendScore | Relative trend score (0–10) |
result Sub-Fields
The result field contains parallel arrays — each index corresponds to the same trade/bar across all keys:
| Field | Description |
|---|---|
Start Date | Trade start dates |
Symbol | Symbol |
Signal | Signal names |
Direction | Trade directions |
TimeInMarket | Holding periods |
ProfitTarget | Take-profit percentages |
StopLoss | Stop-loss percentages |
Kelly | Kelly allocation factors |
StayInMarket | Bars remaining in market |
Shares | Number of shares |
Price | Entry prices |
Close | Exit/close prices |
FloatProfit | Floating P&L |
OrderStatus | Order statuses |
Action | Trade actions (Buy/Sell/Hold) |
Task Status Values:
| Status | Description |
|---|---|
PENDING |
Task waiting to be processed |
RUNNING |
Task is being processed |
SUCCESS |
Task completed successfully |
FAILED |
Task encountered an error |
List Tasks
GET /smart-scanner-backtest/tasks?status=SUCCESS&limit=20&offset=0
List tasks for the authenticated user.
Query Parameters:
| Name | Required | Description |
|---|---|---|
| status | string | Filter by status: PENDING, RUNNING, SUCCESS, FAILED |
| limit | No | Max tasks to return (default 20, max 200) |
| offset | No | Pagination offset (default 0) |
Response:
{
    "tasks": [
        {
            "task_id": "a1b2c3d4-e5f6-7890-abcd-ef1234567890",
            "status": "SUCCESS",
            "name": "test_backtest",
            "find_type": "stock/etf",
            "created_at": "2025-06-25T10:30:00"
        }
    ],
    "total": 15,
    "limit": 20,
    "offset": 0
}
Response Fields:
| Field | Description |
|---|---|
tasks |
List of task summary objects |
tasks[].task_id |
Task UUID |
tasks[].status |
Task status |
tasks[].name |
Backtest name |
tasks[].find_type |
Security type filter used |
tasks[].created_at |
Creation timestamp |
total |
Total number of tasks matching filters |
limit |
Max tasks returned per page |
offset |
Pagination offset |
9. Smart Option Scanner
Designed exclusively for Option Sellers, this tool scans over 4,200 assets (S&P 500, Indices, ETFs) to identify premium Short Put opportunities.
We target the statistical "sweet spot"-contracts with 95%-99% Probability of Profit (POP) that maintain a positive Expected Value (EV). Filter by Risk-Adjusted CAGR and EV Score to find the optimal balance between safety and yield, powered by real-time Black-Scholes analytics.
Currently, the table covers option contracts for over 4,200 underlying assets, including S&P 500 components, major indices (e.g., SPX, NDX), and core ETFs. We'll announce updates when additional underlying assets (from other market indices) are added. Helping traders target the "sweet spot" of high win rates (typically 95%-99%). To view it on our website, please click here.
GET /smart-option-scanner/options
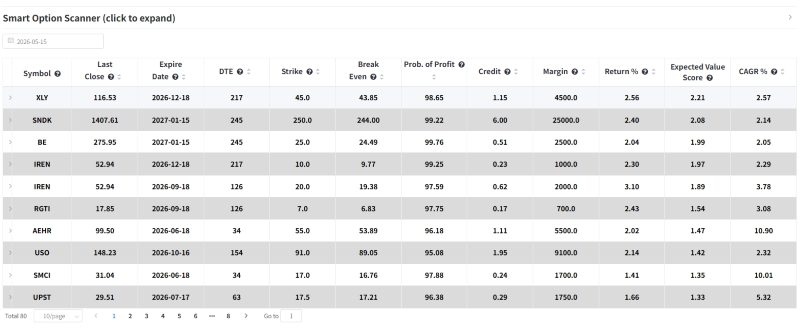
option scanner
Query Parameters
| Name | Type | Required | Description | Example |
|---|---|---|---|---|
| date | string | No | Specific date (optional, default: latest day) | "2025-05-12" |
Response Example
{
    "code": 200,
    "data": {
        "as_of_date": "2026-05-13",
        "option_type": "put",
        "tickers": [
            "AAOI",
            "AEHR",
            "AGI"
            ...
        ],
        "count": 101,
        "option_data": [
            {
                "ticker": "AAOI",
                "close": 223.1,
                "expirDate": "2026-06-18",
                "DTE": 36,
                "strike": 90.0,
                "be": 89.03,
                "POP_est": 98.16,
                "credit": 0.97,
                "margin": 9000.0,
                "return_per": 1.08,
                "ContractSymbol": "AAOI260618P00090000",
                "cagr": 4.32,
                "ev_score": 0.62,
                "Volume": 16.0,
                "OI": 744.0,
                "IV": 1.5781,
                "Delta": 0.0325,
                "Vega": 0.0603
            }
            ...
    ]
  }
}
Response Fields (data object):
| Field | Description |
|---|---|
as_of_date |
Data date (YYYY-MM-DD) |
option_type |
Option type (always "put" for short put opportunities) |
tickers |
List of underlying ticker symbols |
count |
Number of option contracts returned |
option_data |
Array of option contract records |
Option Data Item Fields:
| Field | Description |
|---|---|
ticker | Ticker symbol of the underlying asset, extracted from the option contract symbol. |
close | Latest closing price of the underlying asset, the basis for calculating option metrics. |
expirDate | Expiration date of the option contract, after which the contract has no value if not exercised. |
DTE | Days to Expiration. Formula: Expire Date - Last Trade Date. |
strike | The agreed-upon price at which the option holder can buy or sell the underlying asset. |
be | Break Even — the underlying price at which the option seller neither profits nor loses at expiration. Formula for short options: Strike - Credit. |
POP_est | Probability of Profit — the probability that the seller profits if held to expiration, calculated via the Black-Scholes model. |
credit | The premium received by the seller for selling one option contract, sourced from lastPrice. |
margin | The margin required by the broker for the seller to hold this position. Formula: Strike × 100. |
return_per | Return on margin. Formula: (Credit / Margin) × 100. |
ev_score | Expected Value Score — the risk-adjusted expected return on margin. Formula: [(Win% × NetCredit) - (Loss% × TailLoss)] / Margin. TailLoss is derived from a dynamic 1.2σ stress test based on IV; NetCredit includes a 2% slippage deduction. |
cagr | Compound Annual Growth Rate. Formula: EV Score × (252 / DTE), annualized over 252 trading days per year. |
Volume | Volume |
OI | Open Interest |
IV | Implied Volatility |
Delta | Delta |
Vega | Vega |
ContractSymbol | Contract Symbol |
10. Screens
Predefined screeners that return filtered stock, ETF, commodity, and sentiment data based on curated criteria.
10.1 Get Predefined Screens
GET /screens/get-predefined-screens
Returns all available screen categories with keys and names.
Response Format
{
    "code": 200,
    "data": {
        "screens": [
            {
                "key": "stocks-long-ideas",
                "category": "Stocks - Long Ideas Screen"
            },
            ...
        ]
    }
}
Response Fields (data object):
| Field | Description |
|---|---|
screens |
List of available screen definitions |
screens[].key |
Unique key to use with GET /screens |
screens[].category |
Human-readable category name |
10.2 Get Screen Data
GET /screens?key=xxx&date=YYYY-MM-DD
Get screener data by key. Use GET
/screens/get-predefined-screens to see all available keys.
Query Parameters
| Name | Type | Required | Description | Example |
|---|---|---|---|---|
| key | string | Yes | Screen key | "sp1500-dividend" |
| date | string | No | Specific date (YYYY-MM-DD). Only effective for Long/Short Ideas screens. | "2025-06-01" |
Response Format
{
    "code": 200,
    "data": [
        {
            "symbol": "xlb",
            "chart_name": "XLB Optix",
            "last_value": 51.3106,
            "last_update": "2026-06-17",
            "name": "Basic Materials (XLB)",
            "over_10": 56.0,
            "over_200": 40.0
        },
        ...
    ],
    "type": "ETF Sector Component Moving Average Screen"
}
Response Fields (top-level):
| Field | Description |
|---|---|
data |
Array of screen result records. Fields vary by screen type — see tables below. |
type |
Screen category name |
Response Fields by Screen Category
Each screen key returns a different set of fields in the data[] items:
A. Sentiment & Seasonality Screen
etf-sentiment-seasonality, commod-sentiment-seasonality
| Field | Description |
|---|---|
symbol | Symbol |
name | Name |
group | Category group (e.g. "Index", "Bond") |
last_value | Optix Value |
last_update | Optix Date |
AvgReturn | Avg Return (%) for the current month |
B. Sentiment & Trend Screen
etf-sentiment-trend, commod-sentiment-trend
| Field | Description |
|---|---|
symbol | Symbol |
chart_name | Chart Name |
name | Name |
group | Category group (e.g. "Index", "Bond") |
last_value | Optix Value |
last_update | Optix Date |
close | Close |
MA | 200-Day Moving Average |
C. Long / Short Ideas Screen
stocks-long-ideas, stocks-short-ideas, nasdaq100-long-ideas, nasdaq100-short-ideas, russell3000-long-ideas, russell3000-short-ideas
| Field | Description |
|---|---|
symbol | Symbol |
chart_name | Chart Name |
date | Optix Date |
last_value | Optix Value |
five_ma | Optix 5-Day MA |
equity_close | Closing Price |
ma_200 | Closing Price 200-Day MA |
D. Commodity Hedger Extremes Screen
commod-hedger-extremes
| Field | Description |
|---|---|
symbol | Symbol |
name | Name |
last_value | Last Value |
last_update | Last Update |
three_year_max | 3-Year Max |
three_year_min | 3-Year Min |
net_position | This score shows how extreme the current net position is relative to its 3-year history.It is calculated as: (Current Position - 3-Year Average) / 3-Year Standard Deviation.For example, a score of +1.0 means the current position is one standard deviation more bullish than the 3-year average,while a score of -1.0 means it is one standard deviation more bearish. Scores above +2 or below -2 are considered highly extreme." |
E. ETF Sector MA Screen
etf-sector-ma
| Field | Description |
|---|---|
symbol | Symbol |
chart_name | Optix Name |
name | Symbol Name |
last_value | Optix Value |
last_update | Date |
over_10 | % Over 10MA |
over_200 | % Over 200MA |
F. Optix Exhaustion Screen
optix-exhaustion
| Field | Description |
|---|---|
chart_name | Chart Name |
last_value | Optix Value |
last_update | Date |
group | Group |
10MA | 10-day MA |
G. Dividend Screen
sp1500-dividend, nasdaq100-dividend
| Field | Description |
|---|---|
name | Name |
symbol | Symbol |
report_date | Report date (YYYY-MM-DD) |
divyield | Dividend yield (%) |
pe_ratio | P/E ratio |
onemonthperf | 1-month performance (%) |
threemonthperf | 3-month performance (%) |
sixmonthperf | 6-month performance (%) |
oneyearperf | 1-year performance (%) |
twoyearperf | 2-year performance (%) |
eps_growth | EPS growth (%) |
payout_ratio | Dividend payout ratio (%) |
Available Screens
| Key | Category |
|---|---|
etf-sentiment-seasonality |
ETF Sentiment & Seasonality Screen |
commod-sentiment-seasonality |
Commodity Sentiment & Seasonality Screen |
etf-sentiment-trend |
ETF Sentiment & Trend Screen |
commod-sentiment-trend |
Commodity Sentiment & Trend Screen |
stocks-long-ideas |
Stocks - Long Ideas Screen |
stocks-short-ideas |
Stocks - Short Ideas Screen |
nasdaq100-long-ideas |
NASDAQ 100 Stocks - Long Ideas Screen |
nasdaq100-short-ideas |
NASDAQ 100 Stocks - Short Ideas Screen |
russell3000-long-ideas |
Russell 3000 Stocks - Long Ideas Screen |
russell3000-short-ideas |
Russell 3000 Stocks - Short Ideas Screen |
commod-hedger-extremes |
Commodity Hedgers trading at 3-year Max or 3-year Min |
etf-sector-ma |
ETF Sector Component Moving Average Screen |
optix-exhaustion |
Optix Exhaustion Screen |
sp1500-dividend |
S&P 1500 Stock Dividend Screen |
nasdaq100-dividend |
NASDAQ 100 Stock Dividend Screen |
11. Reports
Get blog post reports by report type and count.
11.1 Get Predefined Report Types
GET /reports/get-predefined-report-types
Returns all available report types.
Response Example
{
    "code": 200,
    "data": {
        "report_types": [
            {"type": "quantedge", "name": "QuantEdge"},
            {"type": "modeledge", "name": "ModelEdge"},
            {"type": "sentimentedge", "name": "SentimentEdge"},
            {"type": "tradingedge", "name": "TradingEdge"}
        ]
    }
}
Response Fields (data object):
| Field | Description |
|---|---|
report_types |
List of available report type definitions |
report_types[].type |
Report type key (use with GET /reports?report_type=) |
report_types[].name |
Human-readable report type name |
11.2 Get Reports
GET /reports
Get the N most recent blog post reports, optionally filtered by report type. If no parameters provided, returns the 5 most recent articles.
Query Parameters
| Name | Type | Required | Description | Example |
|---|---|---|---|---|
| report_type | string | No | Report type filter. Use GET
/reports/get-predefined-report-types to get the full list.
|
"quantedge" |
| n | integer | No | Number of reports to return (default 5, max 10). | 5 |
Request Example — Latest 5 articles (default)
GET /reports
Request Example — Latest 10 quantedge reports
GET /reports?report_type=quantedge&n=10
Response Example
{
    "code": 200,
    "data": [
        {
            "title": "QuantEdge Weekly Report",
            "post_content": "...",
            "author": "Author Name",
            "url": "https://...",
            "publish_date": "2025-06-15"
        }
    ],
    "type": "QuantEdge",
    "count": 1
}
Response Fields:
| Field | Description |
|---|---|
data |
Array of report objects, sorted by publish date (newest first) |
data[].title |
Report title |
data[].post_content |
Full report content (HTML) |
data[].author |
Author name |
data[].url |
URL to the full report on the website |
data[].publish_date |
Publish date (YYYY-MM-DD) |
type |
Report type name (only present when filtered by report_type) |
count |
Number of reports returned |
12. Company Detail
Comprehensive company financial data including profiles, analyst ratings, earnings,
financial statements, news, SEC filings, insider transactions, and institutional holders. All endpoints
require a symbol query parameter unless noted.
Common Parameters:
| Name | Type | Required | Description | Example |
|---|---|---|---|---|
| symbol | string | Yes | Stock ticker symbol | "AAPL" |
| period | string | No | Period type for financial statements (12.5/12.6/12.7 only): annually or quarterly (default: annually) |
"quarterly" |
12.1 Market Prediction
GET /company_detail/market_pred
Returns a complete company profile, latest financial metrics, trading statistics, analyst ratings, and price targets in a single request.
Request:
GET /company_detail/market_pred?symbol=AAPL
Response:
{
    "code": 200,
    "msg": "Get full company and analysis info for 'AAPL' success",
    "data": {
        "profile_info": {
            "meta": {"symbol": "AAPL", "description": "Company basic profile information"},
            "data": {"companyName": "Apple Inc.", "exchange": "NASDAQ", ...}
        },
        "latest_detail": {
            "meta": {"description": "Latest daily detail metrics and indicators"},
            "data": {"market_cap": 3500000000000, "pe_ratio": 32.5, "pb_ratio": 45.2, ...}
        },
        "trading_stat": {
            "meta": {"description": "Trading statistics and moving averages"},
            "data": {"price": 225.5, "open_price": 224.0, "previous_close": 223.5, "volume": 50000000, ...}
        },
        "rating_data": {
            "meta": {"description": "Latest analyst ratings and consensus"},
            "data": {
                "analyst_ratings_buy": 15,
                "analyst_ratings_hold": 8,
                "analyst_ratings_sell": 2,
                "analyst_ratings_buy_percent": 56.25,
                "analyst_ratings_hold_percent": 31.25,
                "analyst_ratings_sell_percent": 7.5
            }
        },
        "pt_data": {
            "meta": {"description": "Analyst price targets summary"},
            "data": "[{\"date\": \"2026-09-01\", \"target_mean\": 250, \"price_min\": 180, \"price_max\": 300, \"num\": 15, \"accuracy_mean\": 85.5}]"
        }
    }
}
Response Fields:
data.profile_info.data — Company profile:
| Field | Description |
|---|---|
companyName | Full company name |
exchange | Trading exchange |
industry | Company industry |
description | Business description |
data.latest_detail.data — Key financial metrics:
| Field | Description |
|---|---|
date | Metric reporting date |
market_cap | Market capitalization in USD |
pe_ratio | Price-to-earnings ratio |
pb_ratio | Price-to-book ratio |
price_to_sales_ratio | Price-to-sales ratio |
ev_to_sales | Enterprise value to sales ratio |
enterprise_value_over_ebitda | EV/EBITDA ratio |
beta | Beta coefficient |
roe | Return on equity |
current_ratio | Current ratio (liquidity) |
free_cash_flow_yield | Free cash flow yield |
dividend_yield | Dividend yield |
data.trading_stat.data — Trading statistics:
| Field | Description |
|---|---|
price | Latest close price |
open_price | Opening price |
previous_close | Previous close price |
day_high | Day's high price |
day_low | Day's low price |
year_high | 52-week high price |
year_low | 52-week low price |
volume | Trading volume |
avg_volume | Average trading volume |
atr14 | Average True Range (14-day) |
ma200_distance | Distance from 200-day moving average (%) |
relative_volume | Relative volume vs average |
data.rating_data.data — Analyst ratings:
| Field | Description |
|---|---|
analyst_ratings_buy | Number of buy ratings |
analyst_ratings_hold | Number of hold ratings |
analyst_ratings_sell | Number of sell ratings |
analyst_ratings_strong_buy | Number of strong buy ratings |
analyst_ratings_strong_sell | Number of strong sell ratings |
analyst_ratings_buy_percent | Buy ratings as % of total |
analyst_ratings_hold_percent | Hold ratings as % of total |
analyst_ratings_sell_percent | Sell ratings as % of total |
analyst_ratings_strong_buy_percent | Strong buy ratings as % of total |
analyst_ratings_strong_sell_percent | Strong sell ratings as % of total |
data.pt_data.data — Price targets (JSON string), each item:
| Field | Description |
|---|---|
date | Analysts expect the stock to reach the target price before this date |
target_mean | Mean of all analyst targets |
price_min | Stock's lowest price during the period before the target date |
price_max | Stock's highest price during the period before the target date |
num | Number of analysts |
accuracy_mean | Mean accuracy of analyst predictions (%) |
12.2 Company Profile
GET /company_detail/get_profile
Combined company profile, latest financial metrics, and trading statistics.
Request:
GET /company_detail/get_profile?symbol=AAPL
Response:
{
    "code": 200,
    "msg": "Get company info for 'AAPL' success",
    "data": {
        "profile": {"companyName": "Apple Inc.", "exchange": "NASDAQ", ...},
        "latest_detail": {"market_cap": 3500000000000, "pe_ratio": 32.5, ...},
        "trading_stat": {"price": 225.5, "price_avg_50": 220.1, ...}
    }
}
Response Fields:
| Field | Description |
|---|---|
data.profile | Company profile object — companyName, exchange, industry, description (business description) |
data.latest_detail | Key financial metrics — date, market_cap, pe_ratio, pb_ratio, price_to_sales_ratio, ev_to_sales, enterprise_value_over_ebitda, beta, roe, current_ratio, free_cash_flow_yield, dividend_yield |
data.trading_stat | Trading statistics — price, open_price, previous_close, day_high, day_low, year_high, year_low, volume, avg_volume, atr14, ma200_distance, relative_volume |
12.3 Analyst Analysis
GET /company_detail/get_analysis
Analyst ratings consensus (with calculated percentages) and price target data.
Request:
GET /company_detail/get_analysis?symbol=AAPL
Response:
{
    "code": 200,
    "msg": "Get analyst for 'AAPL' success",
    "data": {
        "rating_data": {
            "analyst_ratings_buy": 15,
            "analyst_ratings_hold": 8,
            "analyst_ratings_sell": 2,
            "analyst_ratings_strong_buy": 5,
            "analyst_ratings_strong_sell": 0,
            "analyst_ratings_buy_percent": 50.0,
            "analyst_ratings_hold_percent": 26.67,
            "analyst_ratings_sell_percent": 6.67,
            "analyst_ratings_strong_buy_percent": 16.67,
            "analyst_ratings_strong_sell_percent": 0.0
        },
        "pt_data": "[{\"target_mean\": 250, \"price_min\": 180, ...}]"
    }
}
Response Fields:
data.rating_data — same fields as data.rating_data.data in 12.1 above
data.pt_data — same fields as data.pt_data.data in 12.1 above
12.4 Earnings Data
GET /company_detail/get_earning
Earnings surprises, history, and upcoming earnings with calculated metrics (EPS surprise, revenue surprise, QoQ/YoY growth).
Request:
GET /company_detail/get_earning?symbol=AAPL
Response:
{
    "code": 200,
    "msg": "Get earning for 'AAPL' success",
    "data": {
        "earning_data": {
            "newest_date": "2025-12-15",
            "avg_eps": 1.62,
            "avg_eps_surprise": 3.45,
            "beat_count": 10,
            "miss_count": 2,
            "history_earn_data": "[{\"fiscal_date_ending\": \"2024-09-30\", \"eps\": 1.64, \"eps_estimated\": 1.60, \"eps_surprise\": 2.5, ...}]",
            "upcoming_earn_data": "[{\"fiscal_date_ending\": \"2025-03-31\", ...}]"
        }
    }
}
Response Fields:
data.earning_data — Summary:
| Field | Description |
|---|---|
newest_date | Most recent closing price date (reference for beat/miss classification) |
avg_eps | Average reported EPS across the last 12 quarters |
avg_eps_surprise | Average EPS surprise % — (eps / eps_estimated - 1) * 100 |
beat_count | Number of quarters where |EPS surprise| < 10% |
miss_count | Number of quarters where |EPS surprise| >= 10% |
history_earn_data (JSON string) — each item:
| Field | Description |
|---|---|
fiscal_date_ending | Quarter end date |
eps | Reported EPS |
eps_estimated | Consensus EPS estimate |
eps_surprise | EPS surprise % — (actual / estimated - 1) * 100 |
revenue | Reported revenue |
revenue_estimated | Consensus revenue estimate |
revenue_surprise | Revenue surprise in $ — actual - estimated |
qoq_growth | Quarter-over-quarter EPS growth % |
yoy_growth | Year-over-year EPS growth % |
upcoming_earn_data (JSON string) — each item:
| Field | Description |
|---|---|
fiscal_date_ending | Quarter end date |
eps_estimated | EPS estimate for upcoming quarter |
revenue_estimated | Revenue estimate for upcoming quarter |
12.5 Income Statement
GET /company_detail/get_income
Income statement data with calculated ratios (growth rates, margins). Returns the most recent 5 years of data.
Request:
GET /company_detail/get_income?symbol=AAPL&period=quarterly
Response:
{
    "code": 200,
    "msg": "Get income for 'AAPL' success",
    "data": {
        "income_data": "[{\"date\": \"2024-09-30\", \"revenue\": 94930000000, \"net_income\": 23636000000, \"gross_margin\": 0.4638, ...}]"
    }
}
data.income_data is a JSON string (not a parsed array). Parse it to access the array of records.
Response Fields:
| Field | Description |
|---|---|
date | Period end date |
filling_date | Filing date with SEC |
revenue | Total revenue |
gross_profit | Revenue minus cost of revenue |
operating_income | Gross profit minus operating expenses |
net_income | Bottom-line profit after all expenses and taxes |
ebitda | Earnings before interest, taxes, depreciation, and amortization |
gross_profit_ratio | Gross profit margin — gross_profit / revenue |
operating_income_ratio | Operating margin — operating_income / revenue |
net_income_ratio | Net profit margin — net_income / revenue |
ebitdaratio | EBITDA margin — ebitda / revenue |
eps | Earnings per share (basic) — net income / weighted average shares outstanding |
epsdiluted | Earnings per share (diluted) — includes potential dilution from options, convertibles, etc. |
revenue_growth_yoy | Year-over-year revenue growth rate — (revenue_this_period / revenue_same_period_last_year) - 1 |
gross_profit_growth_yoy | Year-over-year gross profit growth rate |
operating_income_growth_yoy | Year-over-year operating income growth rate |
net_income_growth_yoy | Year-over-year net income growth rate |
ebitda_growth_yoy | Year-over-year EBITDA growth rate |
gross_margin | Gross profit as % of revenue — same as gross_profit_ratio |
operating_margin | Operating income as % of revenue — same as operating_income_ratio |
net_margin | Net income as % of revenue — same as net_income_ratio |
ebitda_margin | EBITDA as % of revenue — same as ebitdaratio |
12.6 Balance Sheet
GET /company_detail/get_balance
Balance sheet data with calculated ratios. Returns the most recent 5 years of data.
Request:
GET /company_detail/get_balance?symbol=AAPL&period=annually
Response:
{
    "code": 200,
    "msg": "Get balance for 'AAPL' success",
    "data": {
        "balance_data": "[{\"date\": \"2024-09-30\", \"total_assets\": 364980000000, \"total_liabilities\": 308030000000, \"current_ratio\": 0.97, ...}]"
    }
}
data.balance_data is a JSON string (not a parsed array). Parse it to access the array of records.
Response Fields:
| Field | Description |
|---|---|
date | Period end date |
filling_date | Filing date with SEC |
cash_and_cash_equivalents | Cash and short-term liquid assets |
total_current_assets | Sum of all current assets |
total_assets | Total resources owned by the company |
total_current_liabilities | Sum of all current liabilities |
long_term_debt | Debt due after one year |
total_liabilities | Total debts and obligations |
total_stockholders_equity | Net worth (assets minus liabilities) |
total_debt | Short-term plus long-term debt |
current_ratio | Liquidity ratio — total_current_assets / total_current_liabilities. Above 1.0 means the company can cover short-term obligations |
debt_to_equity | Leverage ratio — total_liabilities / total_stockholders_equity. Lower means less financial risk |
12.7 Cash Flow Statement
GET /company_detail/get_cash
Cash flow statement data with calculated ratios. Returns the most recent 5 years of data.
Request:
GET /company_detail/get_cash?symbol=AAPL&period=quarterly
Response:
{
    "code": 200,
    "msg": "Get cash for 'AAPL' success",
    "data": {
        "cash_data": "[{\"date\": \"2024-09-30\", \"net_cash_provided_by_operating_activities\": 30560000000, \"free_cash_flow\": 27022000000, \"fcf_to_ocf_ratio\": 0.884, ...}]"
    }
}
data.cash_data is a JSON string (not a parsed array). Parse it to access the array of records.
Response Fields:
| Field | Description |
|---|---|
date | Period end date |
filling_date | Filing date with SEC |
net_cash_provided_by_operating_activities | Cash generated from operations |
capital_expenditure | Capital spending (CapEx) |
free_cash_flow | Operating cash flow minus CapEx |
net_change_in_cash | Net increase/decrease in cash |
cash_at_end_of_period | Cash balance at period end |
cash_at_beginning_of_period | Cash balance at period start |
fcf_to_ocf_ratio | Cash conversion efficiency — free_cash_flow / net_cash_provided_by_operating_activities. Closer to 1.0 means less capital-intensive business |
12.8 Company News
GET /company_detail/get_news
Latest 50 news articles for a company.
Request:
GET /company_detail/get_news?symbol=AAPL
Response:
{
    "code": 200,
    "msg": "Get news for 'AAPL' success",
    "data": {
        "news_data": [
            {"news_title": "Apple Announces New iPhone", "news_url": "https://...", "published_date": "2025-12-01"}
        ]
    }
}
Response Fields:
| Field | Description |
|---|---|
data.news_data | Array of up to 50 most recent news articles. Each item: news_title (article headline), news_url (link to full article), published_date (article publication date) |
12.9 SEC Filings
GET /company_detail/get_sec
Latest 50 SEC filings for a company, with human-readable descriptions for each filing type (10-K, 10-Q, 8-K, Form 4, etc.).
Request:
GET /company_detail/get_sec?symbol=AAPL
Response:
{
    "code": 200,
    "msg": "Get sec for 'AAPL' success",
    "data": {
        "sec_data": [
            {
                "sec_type": "10-K",
                "filling_date": "2025-10-31",
                "link": "https://www.sec.gov/...",
                "description": "Annual Report: Comprehensive annual financial report."
            }
        ]
    }
}
Response Fields:
| Field | Description |
|---|---|
data.sec_data[].sec_type | Filing type (10-K, 10-Q, 8-K, etc.) |
data.sec_data[].filling_date | Filing date |
data.sec_data[].link | Link to the filing |
data.sec_data[].description | Filing description |
12.10 Holders & Insider Data
GET /company_detail/get_holder
Insider transactions and institutional/fund holder data.
Request:
GET /company_detail/get_holder?symbol=AAPL
Response:
{
    "code": 200,
    "msg": "Get holder for 'AAPL' success",
    "data": {
        "insider_data": {
            "data": "[{\"transaction_date\": \"2025-11-15\", \"reporting_name\": \"Cook, Timothy D.\", \"type\": \"Sell\", \"securities_transacted\": 50000, \"price\": 225.0, \"value\": 11250000}]"
        },
        "holder_data": {
            "institutional_holders": "[{\"date_reported\": \"2025-09-30\", \"holder\": \"Vanguard Group Inc\", \"shares\": 1300000000, \"change_percent\": 0.5, \"value\": 292500000000}]",
            "fund_holders": "[{\"date_reported\": \"2025-09-30\", \"holder\": \"Fidelity Contrafund\", \"shares\": 50000000, \"change_percent\": -1.2, \"value\": 11250000000}]"
        }
    }
}
Response Fields:
data.insider_data.data (JSON string) — each item:
| Field | Description |
|---|---|
transaction_date | Trade date |
reporting_name | Insider's name |
type | "Buy" or "Sell" |
securities_transacted | Number of shares traded |
price | Transaction price per share |
value | Total transaction value — shares × price |
data.holder_data.institutional_holders (JSON string) — top 10, each item:
| Field | Description |
|---|---|
date_reported | Filing date |
holder | Institution name |
shares | Number of shares held |
change_percent | Share count change % vs prior report |
value | Position value — shares × latest close price |
data.holder_data.fund_holders (JSON string) — top 10, same fields as institutional_holders above (mutual funds and ETFs only)
12.11 All Market Predictions
GET /company_detail/get_pred
All market predictions from the latest date. No symbol parameter needed — returns predictions for all companies.
Request:
GET /company_detail/get_pred
Response:
{
    "code": 200,
    "msg": "Get all pred success",
    "data": {
        "all_pred_data": "[{\"Ticker\": \"AAPL\", \"PredictEndDate\": \"2026-12-31\", \"latest_rating\": \"Buy\", \"Target\": 250, ...}]"
    }
}
Response Fields:
data.all_pred_data (JSON string) — each item:
| Field | Description |
|---|---|
Ticker | Stock ticker symbol |
Target | Predicted price target |
PredictEndDate | Prediction target date — the date by which the model expects the stock to reach its target price |
Close | Close price on prediction date |
MeanAcc | Mean accuracy of the model |
history_count | Number of historical predictions for this ticker |
latest_rating | Model rating: "Strong Sell" / "Sell" / "Hold" / "Buy" / "Strong Buy" |
13. Health Check
Check API service status
Endpoint
GET /health
Response
{
  "status": "ok"
}
Response Fields:
| Field | Description |
|---|---|
status |
Service status. Returns "ok" when the API is running. |
Appendix: Holiday List
Common holiday names available in Seasonality endpoint:
- New Year's Day
- MLK Jr. Day
- President's Day
- Good Friday
- Memorial Day
- Independence Day
- Labor Day
- Thanksgiving Day
- Christmas Day
- Election Day (US)
- FOMC Decision Day
- Monthly Option Expiration
- March Quad Option Expiration
- June Quad Option Expiration
- September Quad Option Expiration
- December Quad Option Expiration